Learning objectives:
- Set up a working Java programming environment and use the
algs4.jarlibrary - Apply the union–find data structure to a scientific application
- Observe the impact of algorithm efficiency on real-world performance
Getting Started
Grading
Your grade for this assignment comes from two components:
- Completion credit (1%): Submit code that compiles by the completion deadline.
- Code review credit (4%): Demonstrate your understanding of the assignment during a one-on-one code review with a TA.
The autograder provides feedback only, it does not determine your grade. See the assignment FAQ for more details on the grading policy.
Our recommendation. Write your own code from scratch and aim to complete every requirement by the completion deadline. Treat each assignment as if the autograder score determined your grade. Working code that you understand is the sweet spot: it makes demos easy and reflects real learning. Start early to give yourself time to debug.
The autograder is your ally: use it to catch bugs before your code review. The time you spend debugging builds exactly the understanding that code reviews test, while copying working code skips this process entirely. When you're stuck, use course resources (Ed, office hours, lab TAs). They help you understand the problem, whereas LLMs tend to hand you solutions you can't explain. Honest partial progress is always better than code you don't understand: in your code review, you earn partial credit for acknowledging incomplete work, but none for claiming something works when you can't demonstrate it.
Install a Java programming environment
Install a Java programming environment on your computer. We recommend (but do not require) these step-by-step instructions for macOS, Windows, or Linux.
If you followed our instructions, the commands javac-algs4 and java-algs4
will classpath in algs4.jar,
which contains Java classes for I/O and all of the algorithms in the textbook.
How do I use algs4.jar?
- IntelliJ: Use the supplied project folder. It adds
algs4.jarto the Java classpath and supports autoimport. IntelliJ will automatically add and removeimportstatements as needed. - Bash command line: If you used our autoinstaller, the commands
javac-algs4andjava-algs4addalgs4.jarto the Java classpath. - Another IDE: Use your IDE's mechanism for adding
algs4.jarto the Java classpath. - Another command line: Use your command-line's mechanism for adding
algs4.jarto the Java classpath.
Should I implement the union–find data structures from scratch? No, use the versions in algs4.jar. On some assignments (such as this one), you will apply classic algorithms and data structures from the textbook to solve interesting problems. On other assignments, you will implement fundamental algorithms and data structures from scratch. Both are important skills.
TigerFile and the Autograder
Submit your assignment using TigerFile. You will need to log in with your Princeton NetID.
Each assignment has a completion deadline. Submitting code that compiles by the completion deadline earns full completion credit. You do not need to pass all tests, just submit something that compiles.
The autograder runs automatically when you submit and provides feedback on correctness and style. Use it to check your work before the deadline. Note that the autograder is for feedback only; your grade comes from completion and code reviews, not from autograder scores. See the policy page on the course website for more information.
Percolation
Given a composite system comprised of randomly distributed insulating and metallic materials: what fraction of the materials need to be metallic so that the composite system is an electrical conductor? Given a porous landscape with water on the surface (or oil below), under what conditions will the water be able to drain through to the bottom (or the oil to gush through to the surface)?
Scientists have defined an abstract process known as percolation to model such situations.
The model
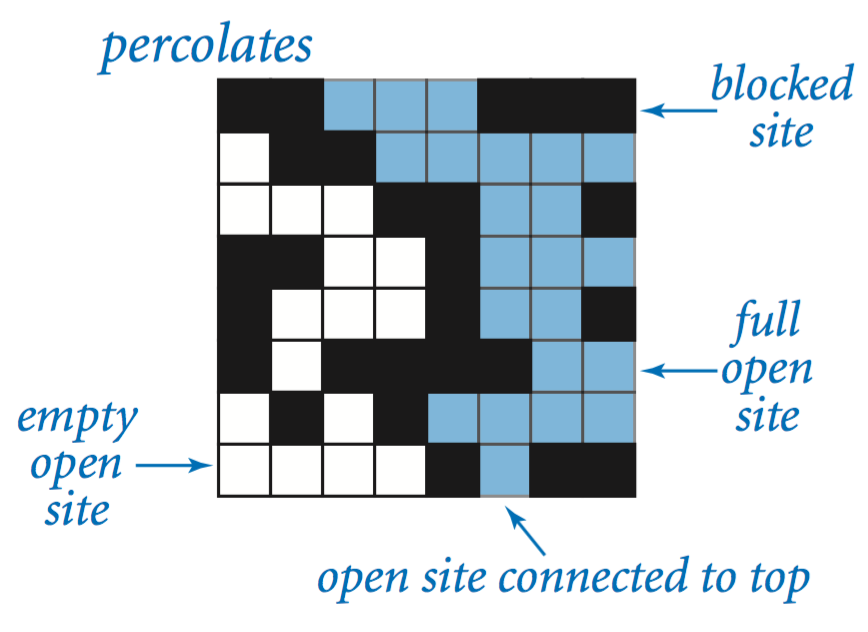
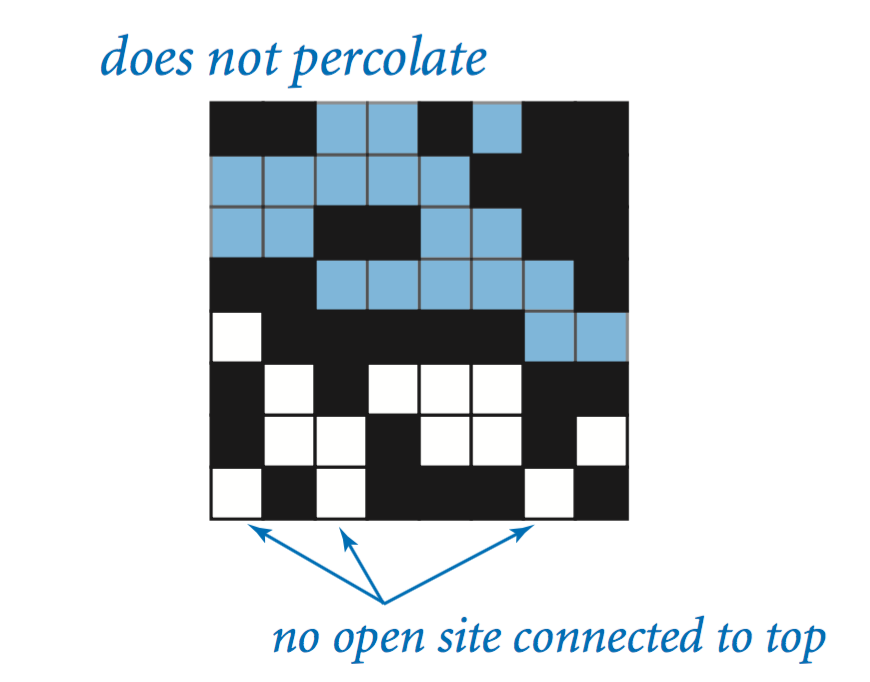
We model a percolation system using an n-by-n grid of sites. Each site is either open or blocked.
A full site is an open site that can be connected to an open site in the top row via a chain of neighboring (left, right, up, down) open sites.
We say the system percolates if there is a full site in the bottom row. In other words, a system percolates if we fill all open sites connected to the top row and that process fills some open site on the bottom row.
(For the insulating/metallic materials example, the open sites correspond to metallic materials, so that a system that percolates has a metallic path from top to bottom, with full sites conducting. For the porous substance example, the open sites correspond to empty space through which water might flow, so that a system that percolates lets water fill open sites, flowing from top to bottom.)
The problem
In a famous scientific problem, researchers are interested in the following question: if sites are independently set to be open with probability $p$ (and, therefore, blocked with probability $1 − p$), what is the probability that the system percolates?
When $p$ equals 0, the system does not percolate; when $p$ equals 1, the system percolates.
The plots below show the site vacancy probability $p$ versus the percolation probability for random 20-by-20 grids (left) and 100-by-100 grids (right).
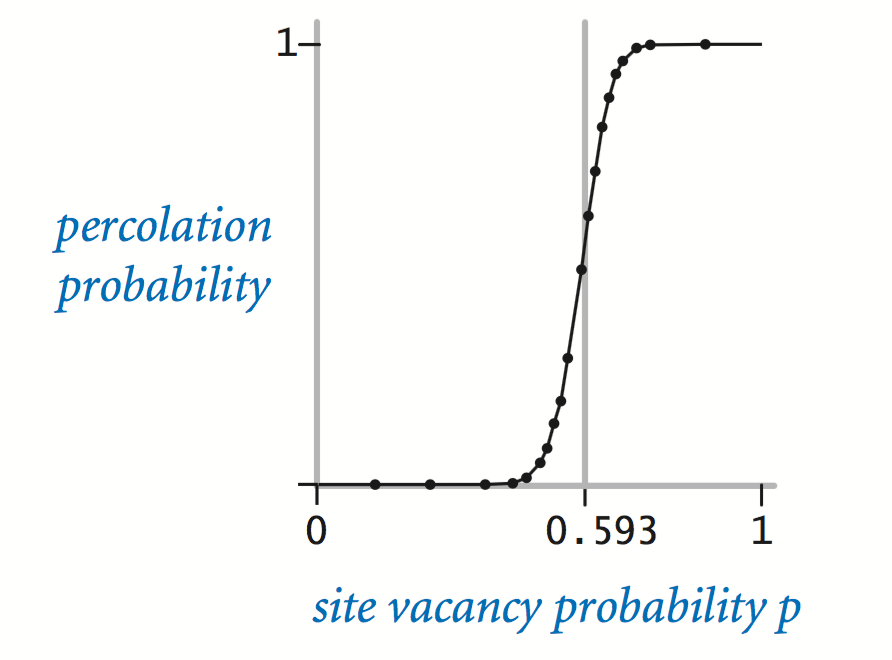
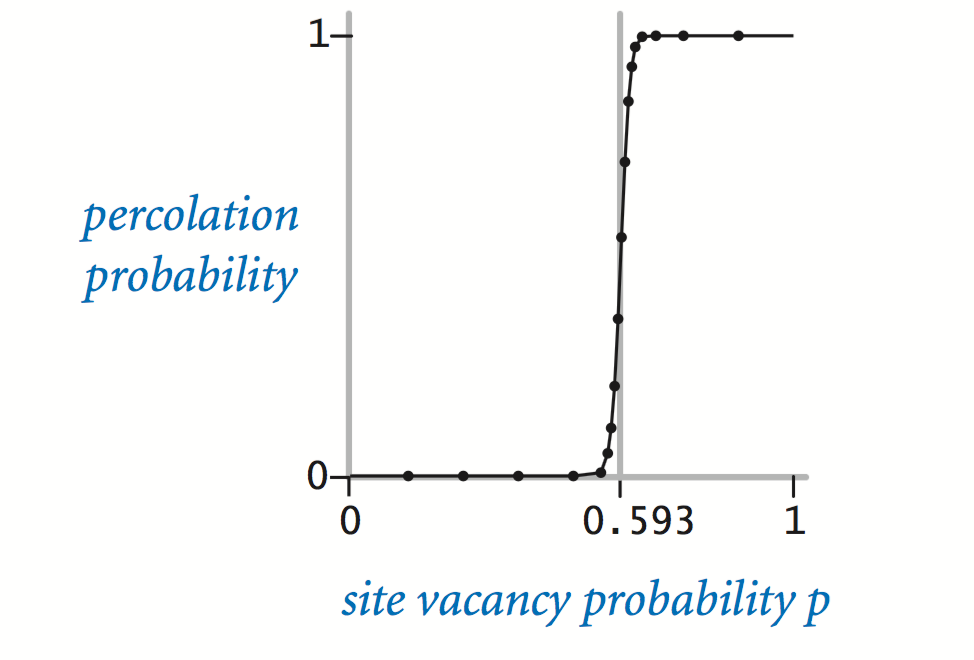
When $n$ is sufficiently large, there is a threshold value $p^\star$ such that when $p \leq p^\star$ a random $n$-by-$n$ grid almost never percolates, and when $p \geq p^\star$, a random $n$-by-$n$ grid almost always percolates.
No mathematical solution for determining the percolation threshold $p^\star$ has yet been derived. Your task is to write a computer program to estimate $p^\star$.
Percolation data type
To model a percolation system, create a data type Percolation with the following API:
public class Percolation {

    // creates n-by-n grid, with all sites initially blocked
    public Percolation(int n)

    // opens the site (row, col) if it is not open already
    public void open(int row, int col)

    // is the site (row, col) open?
    public boolean isOpen(int row, int col)

    // is the site (row, col) full?
    public boolean isFull(int row, int col)

    // returns the number of open sites
    public int numberOfOpenSites()

    // does the system percolate?
    public boolean percolates()

    // unit testing (optional for this class)
    public static void main(String[] args)

}
API requirements
You must implement the API exactly as specified, with the identical set of public methods and signatures; otherwise, the autograder will not be able to test your code. However, you are encouraged to add private methods that enhance the readability, maintainability, and modularity of your program.
Why is this so important? Implementing prescribed APIs is an essential component of modular programming. When you properly implement an API, others can write software to use your module or to test it. For example, your PercolationStats client should work with our Percolation and vice versa.
By convention, the row and column indices are integers between 0 and $n − 1$, where (0, 0) is the upper-left site.
Percolation Requirements
Percolation(int n)
- Behavior: Create an $n$-by-$n$ grid with all sites initially blocked.
- Performance: $O(n^2)$ time
- Corner case: Throw
IllegalArgumentExceptionif $n \leq 0$
open(int row, int col)
- Behavior: Mark the site as open. Connect it to any adjacent open sites using
union(). - Performance: $O(1)$ time plus $O(1)$ calls to
union()andfind() - Corner case: Throw
IllegalArgumentExceptionifroworcolis outside $[0, n-1]$
isOpen(int row, int col)
- Behavior: Return whether the site at (row, col) has been opened.
- Performance: $O(1)$ time
- Corner case: Throw
IllegalArgumentExceptionifroworcolis outside $[0, n-1]$
isFull(int row, int col)
- Behavior: Return whether the site at (row, col) is full (i.e., connected to the top row via open sites).
- Performance: $O(1)$ time plus $O(1)$ calls to
find() - Corner case: Throw
IllegalArgumentExceptionifroworcolis outside $[0, n-1]$
numberOfOpenSites()
- Behavior: Return the number of open sites.
- Performance: $O(1)$ time
percolates()
- Behavior: Return whether the system percolates (i.e., there is a path of open sites from the top row to the bottom row).
- Performance: $O(1)$ time plus $O(1)$ calls to
find()
Unit testing
You are not required to create unit tests for this class. Instead, you may use the visualizers and test files provided in the project folder; see the Testing and Debugging section for more details.
Monte Carlo simulation
To estimate the percolation threshold, consider the following computational experiment:
- Initialize all sites to be blocked.
- Repeat the following until the system percolates:
- Choose a site uniformly at random among all blocked sites (hint: you can use
StdRandom.uniformInt(n)to generate two integers between 0 (inclusive) and $n$ (exclusive), and use this site if it is blocked; if not, try again and repeat until you find a blocked site). - Open the site.
- The fraction of sites that are opened when the system percolates provides an estimate of the percolation threshold.
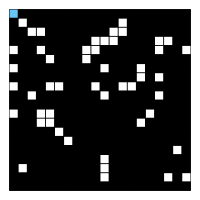
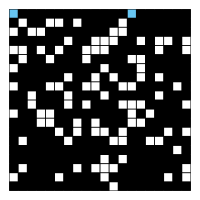
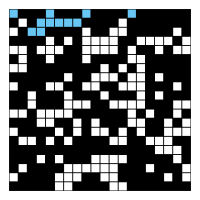
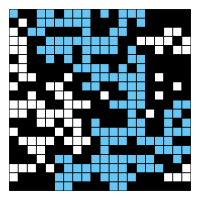
For example, if sites are opened in a 20-by-20 grid according to the snapshots below, then our estimate of the percolation threshold is 204/400 = 0.51 because the system percolates when the 204th site is opened.
By repeating this computational experiment $T$ times and averaging the results, we obtain a more accurate estimate of the percolation threshold. Let $x_t$ be the fraction of open sites in computational experiment $t$. The sample mean $\overline{x}$ provides an estimate of the percolation threshold; the sample standard deviation $s$ measures the sharpness of the threshold.
$$ \overline{x} = \frac{x_1 + x_2 + \cdots + x_T}{T}, \quad s^2 = \frac{(x_1 - \overline{x})^2 + (x_2 - \overline{x})^2 + \cdots + (x_T - \overline{x})^2}{T-1} $$
Assuming $T$ is sufficiently large (say, at least 30), the following provides a 95% confidence interval for the percolation threshold:
$$ \left[ \overline{x} - \frac{1.96 s}{\sqrt{T}}; \overline{x} + \frac{1.96 s}{\sqrt{T}} \right] $$
PercolationStats data type
To perform a series of computational experiments, create a data type PercolationStats
with the following API:
public class PercolationStats {

    // perform independent trials on an n-by-n grid
    public PercolationStats(int n, int trials)

    // sample mean of percolation threshold
    public double mean()

    // sample standard deviation of percolation threshold
    public double stddev()

    // low endpoint of 95% confidence interval
    public double confidenceLow()

    // high endpoint of 95% confidence interval
    public double confidenceHigh()

    // test client
    public static void main(String[] args)

}
The constructor takes two arguments $n$ and $\text{trials}$, and performs $\text{trials}$ independent computational experiments (discussed above) on an $n$-by-$n$ grid.
Standard libraries
Use StdRandom
to generate random numbers; use
StdStats
to compute the sample mean and standard deviation; use
Stopwatch
to measure the running time.
PercolationStats Requirements
PercolationStats(int n, int trials)
- Behavior: Perform $\text{trials}$ independent computational experiments on an $n$-by-$n$ grid. Store the fraction of open sites for each trial.
- Corner case: Throw
IllegalArgumentExceptionif $n \leq 0$ or $\text{trials} \leq 0$
mean()
- Behavior: Return the sample mean of the percolation threshold across all trials.
stddev()
- Behavior: Return the sample standard deviation of the percolation threshold.
confidenceLow()
- Behavior: Return the low endpoint of the 95% confidence interval.
confidenceHigh()
- Behavior: Return the high endpoint of the 95% confidence interval.
main(String[] args)
- Behavior: Take two command-line arguments $n$ and $\text{trials}$, and print the relevant statistics for $\text{trials}$ computational experiments on an $n$-by-$n$ grid. See below for an example.
~/Desktop/percolation> java-algs4 PercolationStats 200 100
mean()           = 0.592993
stddev()         = 0.008770
confidenceLow()  = 0.591275
confidenceHigh() = 0.594712
elapsed time     = 0.373

~/Desktop/percolation> java-algs4 PercolationStats 200 100
mean()           = 0.592877
stddev()         = 0.009991
confidenceLow()  = 0.590919
confidenceHigh() = 0.594835
elapsed time     = 0.364

~/Desktop/percolation> java-algs4 PercolationStats 2 100000
mean()           = 0.666948
stddev()         = 0.117752
confidenceLow()  = 0.666218
confidenceHigh() = 0.667677
elapsed time     = 0.087
Comparison of two data structures
To build intuition about why union–find performance matters in this assignment, run a small performance study comparing two implementations of Percolation. You will not submit results for this section; it is for your own learning and debugging/troubleshooting.
-
Quick-find implementation. Implement
PercolationusingQuickFindUF. Then runPercolationStatswith 100 trials and find the largest value of n your computer can handle in under 1 minute. -
Weighted quick-union implementation. Re-implement
PercolationusingWeightedQuickUnionUF. Again runPercolationStatswith 100 trials and find the largest value of n your computer can handle in under 1 minute.
As you do this, record your results for yourself (e.g., in a notes file) and briefly reflect on what you observed about the runtime difference between the two approaches.
Testing and Debugging
We provide two clients that serve as large-scale visual traces. Use them for testing and debugging your Percolation implementation. The file percolation.zip contains sample data files for use with the visualization client. Associated with most input .txt files is an output .png file that contains the desired graphical output at the end of the visualization.
Visualization client
PercolationVisualizer.java animates the results of opening sites in a percolation system specified by a file:
- Read the grid size n from the file.
- Create an n-by-n grid of sites (initially all blocked).
- Read in a sequence of sites (row, col) to open from the file. After each site is opened, draw full sites in light blue, open sites (that aren't full) in white, and blocked sites in black, with site (0, 0) in the upper-left corner.
~/Desktop/percolation> java-algs4 PercolationVisualizer input20.txtThe program should behave as in this movie and the snapshots shown earlier when used with input20.txt.
Sample input file and visualization snapshots
~/Desktop/percolation> more input20.txt
20
 6 10
17 10
11  4
 8  4
 4  8
 0  0
...
~/Desktop/percolation> java-algs4 PercolationVisualizer input20.txt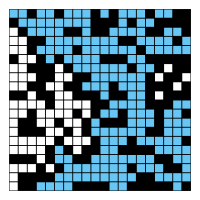
A common "bug"
After the system has percolated, PercolationVisualizer colors in light blue all sites connected to open sites on the bottom (in addition to those connected to open sites on the top). This is called backwash.
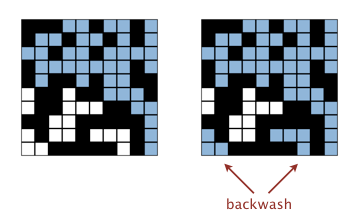
While allowing backwash does not strictly conform to the Percolation API (since isFull() may return incorrect results for some sites), it requires ingenuity to fix so you don't need to do so.
There are some extra tests on the autograder if you'd like to try to implement a solution that meets the performance requirements and has no backwash (see "Further Challenges" below).
Interactive visualization client
InteractivePercolationVisualizer.java is similar to the visualization client except that the input comes from a mouse (instead of from a file). It takes a command-line integer n that specifies the grid size.
~/Desktop/percolation> java-algs4 InteractivePercolationVisualizer 10As a bonus, it writes to standard output the sequence of sites opened in the same format used by PercolationVisualizer, so you can use it to prepare interesting test files.
Deliverables
Project files
The file percolation.zip contains a test client and sample input files. It additionally contains a feedback.txt file, which you should fill out by completing the appropriate fields, and an acknowledgments.txt file, which you should complete with citations and collaboration information.
Submission
Submit only Percolation.java (using the weighted quick-union algorithm from
WeightedQuickUnionUF)
and PercolationStats.java.
We will supply algs4.jar.
Do not call any library functions except those in
StdIn,
StdOut,
StdRandom,
StdStats,
Stopwatch,
WeightedQuickUnionUF,
and java.lang.
Finally, submit feedback.txt and acknowledgments.txt files and answer the questions.
| File | Purpose |
|---|---|
Percolation.java |
Implements the percolation API using WeightedQuickUnionUF. |
PercolationStats.java |
Runs Monte Carlo experiments and reports mean, standard deviation, and confidence interval. |
feedback.txt |
Answers the assignment feedback questions. |
acknowledgments.txt |
Lists collaborators and external resources used. |
Advice and Further Challenges
Suggested Approach
To help you work through the assignment, here is a suggested list of steps for how you might make progress. You don't have to follow this list to complete the assignment and in fact we recommend you don't look at it unless you get stuck.
List of steps.
-
Install a Java programming environment. The easiest way is to use the auto-installer for macOS or Windows.
-
Download percolation.zip, which contains sample data files and test clients.
-
Don't worry about backwash for your first attempt. You can revise your implementation later, time permitting.
-
For each method in
Percolationthat you must implement (e.g.,open()andpercolates()), make a list of which methods inWeightedQuickUnionUF(e.g.,union()andfind()) might be useful. This should help solidify what you're attempting to accomplish. Do not write your own union–find data structure. -
Using the list of methods from the API as a guide, choose instance variables that you'll need. Don't overthink this, you can always change them later.
-
Plan how you're going to map from a 2D (row, column) pair to a 1D union–find index. Write a private method to convert from 2D to 1D coordinates (instead of copying the formula multiple times).
-
Write a private method for validating indices. Since each method must throw an exception for invalid indices, write a helper method (instead of copying validation code multiple times).
-
Write the
Percolationconstructor. Its job is to initialize all of the instance variables. -
Write the
open()method. It should: (1) validate indices, (2) mark the site as open and increment the count if not already open, (3) perform union–find operations to link the site to its open neighbors. -
Test the
open()method and constructor. For example, create aPercolationobject withn = 2, callopen(0, 1)andopen(1, 1), then callpercolates()to check. -
Write
percolates(),isOpen(), andisFull(). These should be simple methods. Each method must use a constant number of union–find operations, if you have a loop inside one of these methods, you're probably doing it wrong. -
Test your complete implementation using the visualization clients.
-
Write and test
PercolationStats. UseStdRandomandStdStats.
Further Challenges
Backwash Challenge 1
Modify your Percolation implementation so that isFull() remains correct even after the system percolates (i.e., no backwash), while still meeting the assignment’s performance expectations. Your solution should satisfy the performance requirements, namely it should use only a constant number of union–find operations.
Backwash Challenge 2
Implement a no-backwash solution that is both time-efficient and memory-efficient. As an additional constraint, use only about $\sim 2n^2$ bytes of extra memory beyond your base solution.