 Fraud Detection
In this assignment you are going to implement a few algorithms which, when put together, form a machine learning model to detect fraudulent credit card transactions. The model you will implement is a (very) simplified version of one that could be employed in the real world. In this process, you will employ a number of algorithms covered throughout this course.
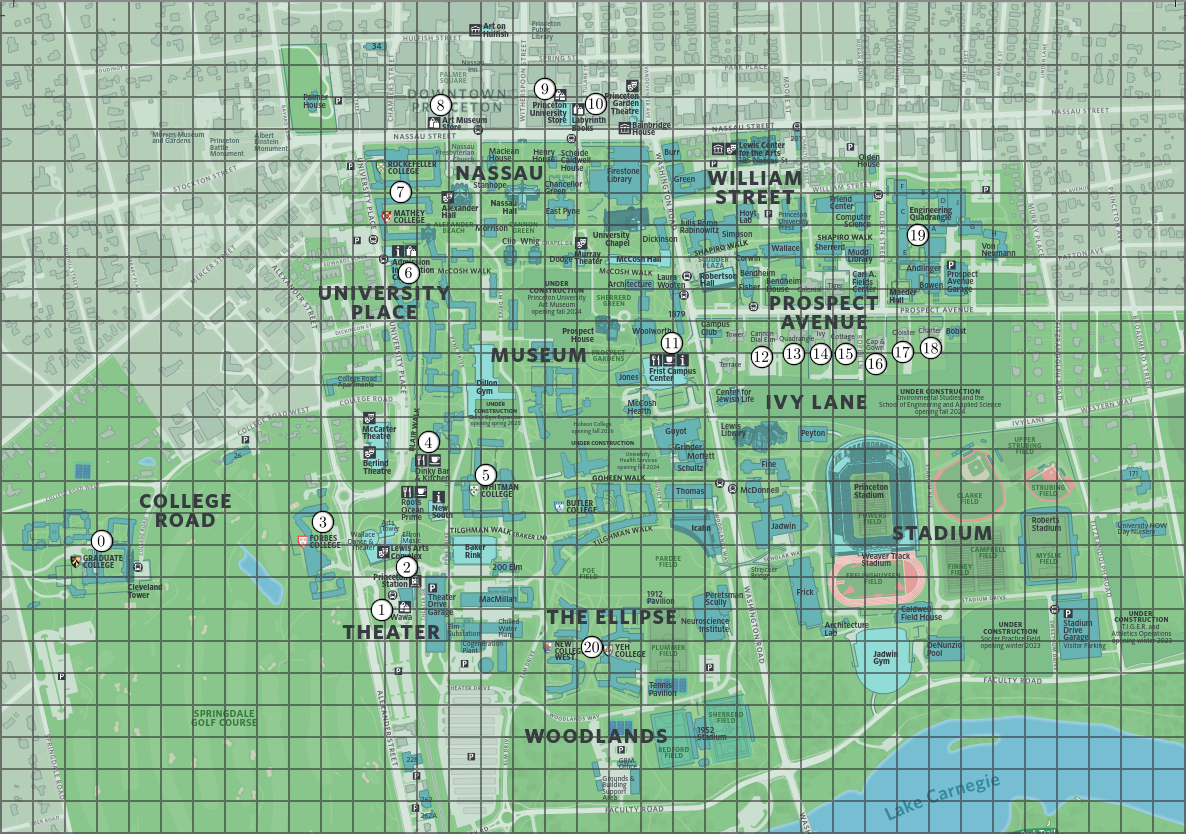
Consider a set of \(m\) points in 2D space, each representing
coordinates of retail establishments, such as shops and restaurants,
on a map. These points are represented using the immutable data
type Point2D
(part of algs4.jar). Below is an example of
locations in a map of Princeton.
Additionally, you are given a data set with \(n \ge 1\) labeled
transaction summaries. A transaction summary is an array of
\(m\) non-negative integers, one per location, representing the
amount of money spent at each location by a particular person. A
label is either clean or fraud,
indicating whether a fraudulent transaction was detected in the
corresponding transaction summary. Here is an example of
one. Each number corresponds to a location in the map (e.g. the
first number represents the amount of money spent at "Graduate
College," the leftmost point).
| 5 | 6 | 7 | 0 | 6 | 7 | 5 | 6 | 7 | 0 | 6 | 7 | 0 | 6 | 7 | 0 | 6 | 7 | 0 | 6 | 7 | clean |
You will create a simple machine learning model that learns from
a data set. That is, you will be given a collection of
labeled transaction summaries and write an algorithm that
labels new transaction summaries as either clean
or fraud. These labels are represented by integers: 0
for clean and 1 for fraud.
Before feeding the data into the machine learning model, you
will first reduce the dimension of the input (i.e. the
transaction summaries) using a clustering algorithm. This
algorithm receives \(m\) locations, as objects of type
Point2D, as well as a number \(k\) (between
1 and \(m\)) of clusters.
The goal is to output a partition of the
points into \(k\) clusters (i.e., groups), such that the points
in the same cluster are similar; in our case, two points are
similar if the Euclidean distance between them is small.
This step is applied not only to make the model more efficient, but it also improves its accuracy by mitigating an overfit of the model to the input data.
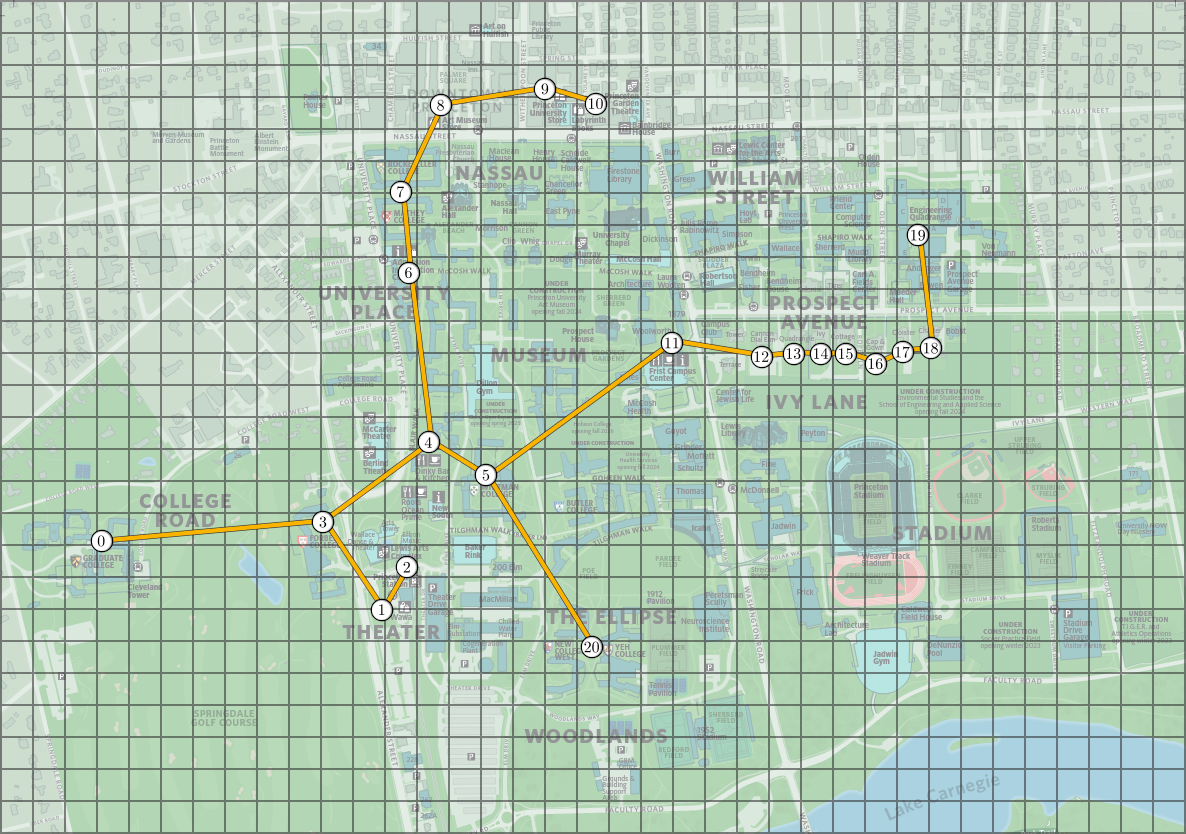
Here is what the clustering algorithm should do:
EdgeWeightedGraph)
with \(m\) vertices (one per location on the map) and an edge
connecting each pair of locations, whose weight is the Euclidean
distance between the two points. The vertices, numbered from
\(0\) to \(m - 1\), must correspond to the sequence of locations
in the input.
You don't have to implement all these steps from scratch; there
are several helpful classes in algs4.jar that you can use (see the
implementation requirements below).
The following images represent the minimum spanning tree and the clusters obtained from the Princeton locations above, with \(k = 5\) clusters. In the image to the right, clusters are indicated by colors and dashed lines represent the edges of the minimum spanning tree that are excluded from the cluster graph.
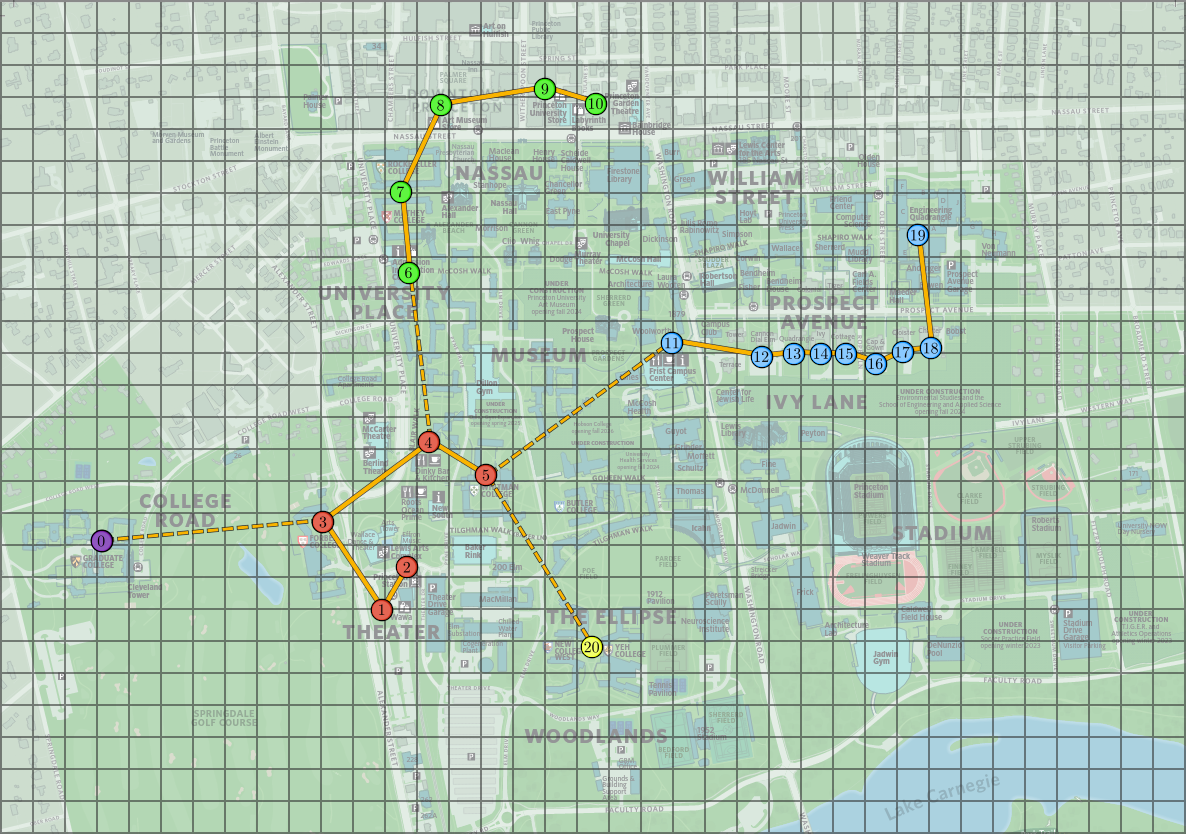
We can now reduce the dimension of each transaction summary by summing all of the entries corresponding to the same cluster, which yields a new array with \(k\) elements (reduced from \(m\)). This is illustrated below, where each color labels a cluster in the image above.
| 5 | 6 | 7 | 0 | 6 | 7 | 5 | 6 | 7 | 0 | 6 | 7 | 0 | 6 | 7 | 0 | 6 | 7 | 0 | 6 | 7 | Original |
| 5 | 26 | 24 | 39 | 7 | Reduced |
To help you test your code, we provide the file princeton_locations.txt
formatted as follows: the first line contains the number \(m\) of locations, followed by \(m\)
lines with the \((x, y)\) coordinates of each location. The order of the points
matches the above images (e.g., the first point represents "Graduate College"). We also include
princeton_locations_mst.txt, which contains
the edges of the Euclidean graph's minimum spanning tree.
Clustering Algorithm. Implement an immutable data type Clustering
with the following API:
public class Clustering {

    // run the clustering algorithm and create the clusters
    public Clustering(Point2D[] locations, int k)

    // return the cluster of the ith location
    public int clusterOf(int i)

    // use the clusters to reduce the dimensions of an input
    public int[] reduceDimensions(int[] input)

    // unit testing (required)
    public static void main(String[] args)
}
Note that clusterOf() must return an integer
between \(0\) and \(k-1\) satisfying the following condition:
clusterOf(i) and clusterOf(j) are equal
if and only if the \(i\)th and \(j\)th points
belong to the same cluster.
Implementation requirements.
You should use
KruskalMST
and CC
to compute a minimum spanning tree and connected components of the cluster graph.
Corner cases.
Throw an IllegalArgumentException if:
null.clusterOf() is not in the range \([0, m - 1]\).reduceDimensions() has a length different from \(m\).Unit testing. In your main() method
you will implement a test that generates a set of points
whose clustering is known in advance. More precisely, you will generate
a set of locations that form tight "point clouds" centered at random
points that are far away from each
other. Here is a thorough description of what you need to do:
Point2D[] array centers[]
of length \(c\), which will represent the centers of
each point cloud. To populate this array, generate random pairs of
doubles in the rectangle \([0, 1000) \times
[0, 1000)\), under the constraint that the Euclidean distance between
any two points is at least \(4\). You can do so using a simple
rejection
sampling algorithm: assign a uniformly random point in the
rectangle to centers[0]; then generate uniformly
random points until you find one at distance at least \(4\)
from centers[0], and assign it
to centers[1]; then generate uniformly random
points until you find one at distance at least \(4\) to
both centers[0] and centers[1]; and so
on, until you fill in all the \(c\) points.Point2D[]
array locations[], of length \(c \cdot p\). You
should populate this array in with the first \(p\) indices
containing random points of distance at most 1
to centers[0]; the next \(p\) indices with random
points of distance of at most 1 to centers[1]; and
so on. You are free to implement this step however you prefer,
but there is a suggested implementation in
the Checklist.Clustering(locations, c) object (so
\(k = c\)). Your implementation is correct if the first \(p\)
points are all in one same cluster, the next \(p\) points are in
another cluster, and so on. You should check if this is the case
and print a message (e.g. "Error!") if not.You should test your implementation with values of \(c\) and \(p\) around \(50\) and it should take up to a few seconds to run.
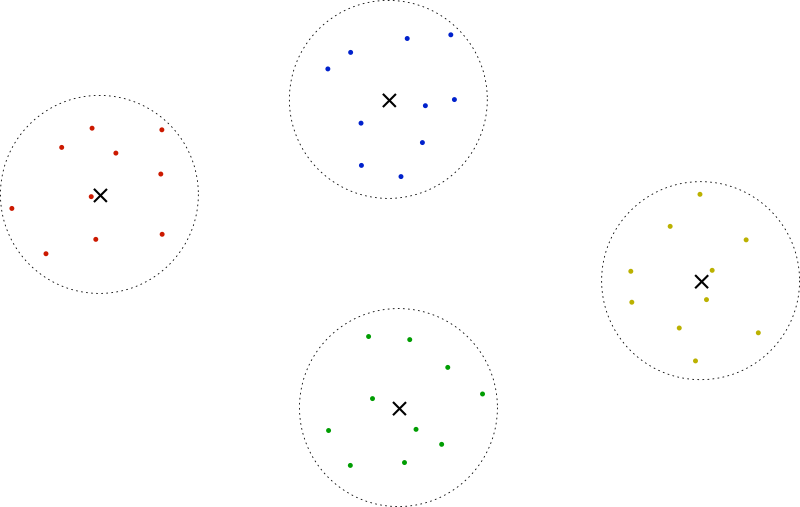
The key reason this works is that points around the same center are closer to each other than to any other point, so they necessarily end up in the same cluster. The image below shows an example with \(c = 4\) centers, represented by crosses, and \(p = 10\) points per center. Each circumference around a center has radius 1 and represents the space of possible locations of the points around that center. Note that the point cloud centers are only for visualization purposes, they don't correspond to locations.
Performance requirements. Your implementation must achieve the following performance requirements:
clusterOf() should run in \(\Theta(1)\) time.reduceDimensions() should run in \(O(m)\) time.A weak learner is a machine learning model that performs marginally better than a random decision. In the context of this assignment, this means predicting the correct label slightly more than \(50\%\) of the time. You will implement a model known as a decision stump, a very popular choice for weak learners.
Your decision stump takes as input a sequence of \(n\) dimension-reduced
transaction summaries, each of which is an array of \(k\) integers.
In other words, the input is a
\(n\)-by-\(k\) array of
integers input[][], where input[i][j] is
the amount of money the reduced transaction summary
i spent at cluster j. Each input is labeled
with an integer, either 0 or 1 (corresponding to clean
or fraud, respectively), given in an integer array labels[]
of length \(n\). Each input is also associated to a non-negative weight,
given by the double[] length-\(n\) array weights[]
(which will be used in the last part of this assignment).
From the input data and labels, the decision stump "learns"
a predictor: a function that takes a single sample
(i.e. a new transaction summary given as an array of \(k\) integers)
as input and outputs a binary
prediction, 0 or 1 (i.e. clean
or fraud). This predictor is a very simple function
which we describe in the following paragraphs.
Note: the following description might seem a bit overwhelming at first. Try to read all of it, then study the examples in the images; the visual representations are really helpful to understand the description.
Since each input is an array of length \(k\), we can think about them as a points in \(k\)-dimensional space (i.e. the \(x\)-coordinate corresponds to the 0 index of the input array, the \(y\)-coordinate corresponds to the 1 index of the input array, and so on). A decision stump classifies a point based on only a single coordinate of the point. For example, \(x \leq 4\) is the decision stump that labels all points with \(x\)-coordinate value less than or equal to \(4\) as 0 and all other points as 1. This definition has a nice geometric interpretation: a decision stump corresponds to a (hyper)plane perpendicular to one of the axes. Given one such (hyper)plane, a decision stump labels all points to one side of that (hyper)plane as 0 and points on the other side as 1. The images below show three examples of decision stumps. The first one has \(k=2\) and corresponds to \(y \leq 2\). The second one has \(k=2\) and corresponds to \(x \leq 5\). The third one has \(k=3\) and corresponds to \(y \geq 4\).
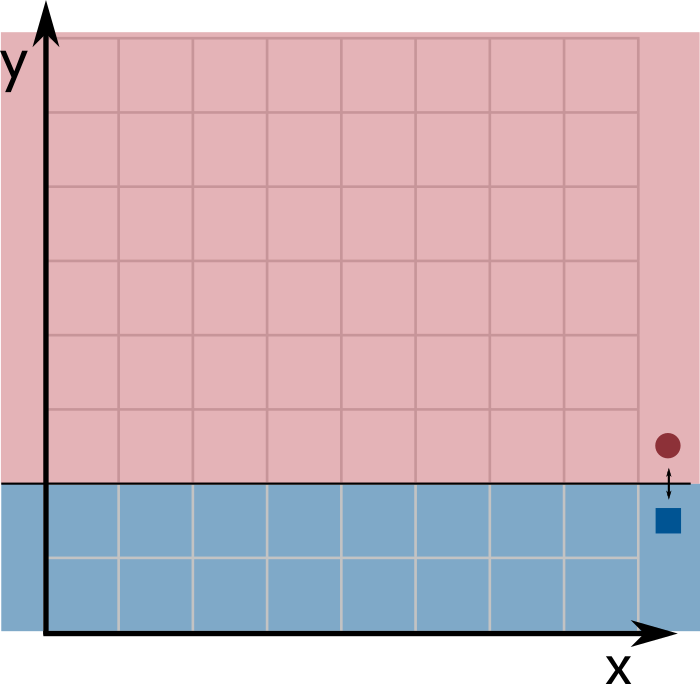
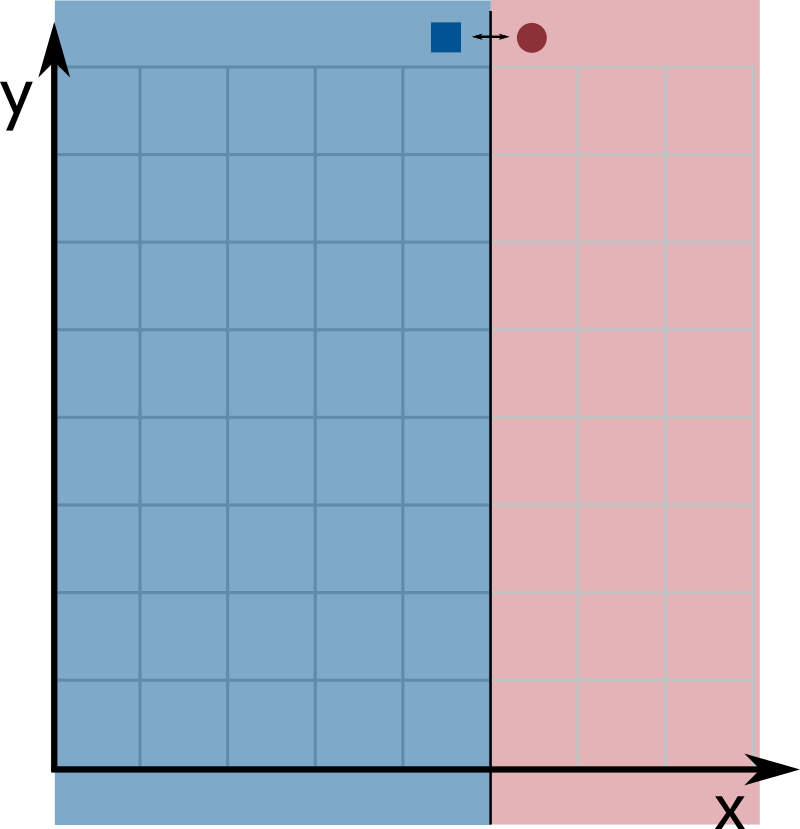
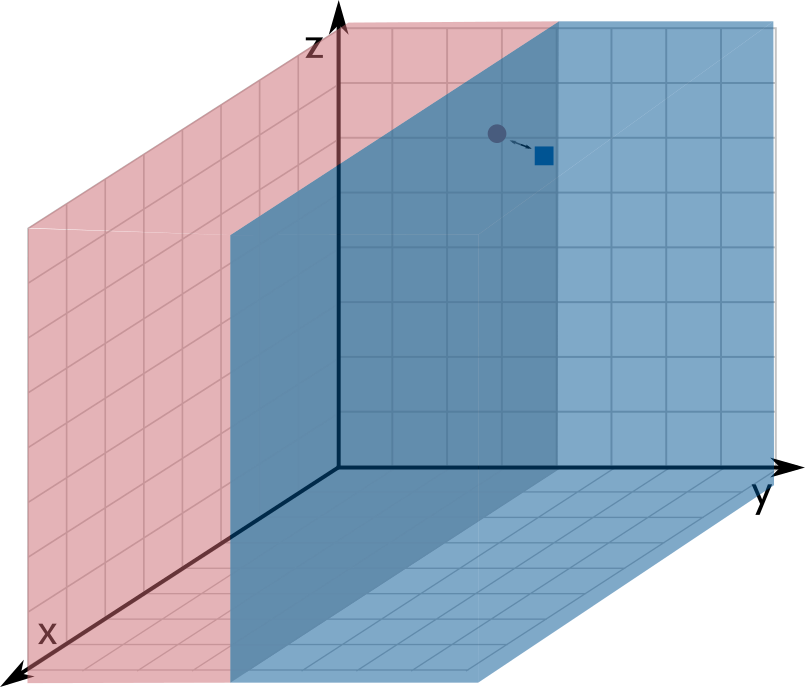
Based on the above, we will use three integers to describe a
decision stump: a dimension predictor \(d_p\), a value
predictor \(v_p\) and a sign predictor \(s_p\). The
dimension predictor is an integer between \(0\) and \(k - 1\),
which represents the dimension/coordinate of the input space
that is partitioned (into the region classified
as 0 and the region classified
as 1). The value predictor is an integer that
determines where the input space is partitioned (i.e. where the
hyperplane crosses its perpendicular axis). The sign predictor is
either \(0\) or \(1\), and determines the direction of the
labels, i.e. which side of the plane gets classified as 0
and which gets classified as 1.
Given a \(k\)-dimensional input point \(\textsf{sample}\), a decision stump with parameters \(d_p\), \(v_p\) and \(s_p\) labels it according to the following rule:
0 if
\(\textsf{sample}[d_p] \leq v_p\) and 1 otherwise.1 if
\(\textsf{sample}[d_p] \leq v_p\) and 0 otherwise.
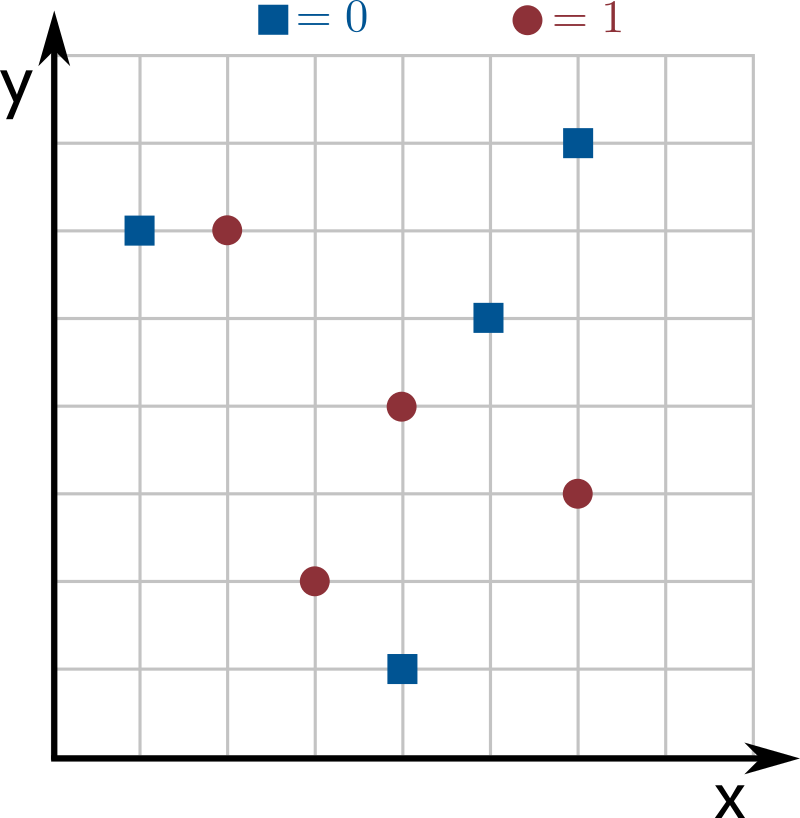
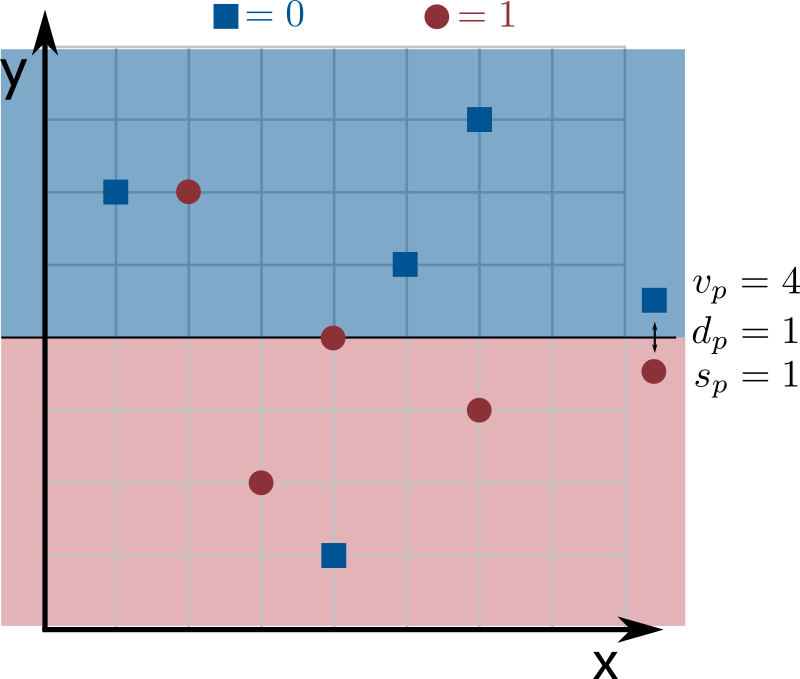
See the images below for an example with \(n = 8\) inputs of
dimension \(k = 2\), where dimensions 0 and 1 correspond to the
the x- and y-axes, respectively. Blue squares
correspond to the label 0 and red circles to the label
1. The line in the image is the hyperplane that splits dimension
\(d_p = 1\) at coordinate \(v_p = 4\) into two regions: since \(s_p = 1\),
points above the line (of \(y\)-coordinate larger than \(4\)) are labeled as
0, and points at or below the line (of \(y\)-coordinate smaller than or equal
to \(4\)) are labeled as 1.
Your goal is to find the decision stump that best represents the
input data (we call this step training the model). That is,
your task is to find the values of \(d_p\), \(v_p\) and \(s_p\) that
maximize the weight of correctly classified inputs,
(i.e., maximizes the sum of the weights of the inputs whose
predicted label matches the corresponding value in labels[]).
If all points have weight \(1\) in the image above, the weight of correctly classified inputs by the given decision stump is \(6\) (all points are correctly classified except for one blue square and one red circle). Since no other decision stump mislabels fewer than 2 points, it is optimal (i.e., is the stump that best represents the training data).
Weak Learner. Implement an immutable data type
class WeakLearner with the following API:
public class WeakLearner {

    // train the weak learner
    public WeakLearner(int[][] input, double[] weights, int[] labels)

    // return the prediction of the learner for a new sample
    public int predict(int[] sample)

    // return the dimension the learner uses to separate the data
    public int dimensionPredictor()

    // return the value the learner uses to separate the data
    public int valuePredictor()

    // return the sign the learner uses to separate the data
    public int signPredictor()

    // unit testing
    public static void main(String[] args)
}
Corner cases.
Throw an IllegalArgumentException if:
null.input[][], weights[], labels[]
or sample[] are incompatible.input[][] is zero or any element of input[][] has zero length.weights[] are not all non-negative.labels[] are not all either 0 or 1.Unit testing. You don't need to create unit tests. Use the visualizer and the examples in the Checklist to test your implementation.
Performance requirements. Your implementation must achieve the following performance requirements:
dimensionPredictor(), valuePredictor(), signPredictor()
and predict() should run in \(\Theta(1)\)
time.WeakLearner.java grade) if your solution runs
\(\Theta(kn^2)\) time.j, there are no two distinct
points i1 and i2 for
which input[i1][j] == input[i2][j]), but fails in
some cases where there are duplicate coordinates, then you will
only get 1 penalty point. The tests on TigerFile are
divided into inputs with no duplicate coordinates and with
duplicate coordinates.Note: it is very easy to miss some corner cases (like when the input has duplicate coordinates) in your implementation of this class. To debug your code using good test cases, read the Checklist section on testing.
As the name suggests, the weak learner is not a very interesting model. You will now implement a better one using a technique called boosting: taking weak learners and improving (boosting) their quality. In this assignment you will implement a simplified version of AdaBoost (short for Adaptive Boosting), which is an application of the multiplicative weights algorithm.
The input consists of a sequence of \(n\) labeled (non-reduced) transaction
summaries is given as an \(n \times m\) integer array input[][]);
the \(m\) map locations (a Point2D[] array of length \(m\));
as well as an integer \(k\) (the number of clusters to cluster the locations
into). You should start by creating a Clustering
object so you can map transaction summaries into arrays of
length \(k\), using the dimensionality reduction method. From
now on, we will use "input" to refer to the reduced transaction
summaries, i.e. the \(n \times k\) array resulting from applied the
dimensionality reduction method to the original transaction
summaries.
AdaBoost is a version of multiplicative weights where the
input points are the experts. The algorithm assigns a
weight to each input point, represented as a double[]
array of length \(n\). This array is normalized, so that the sum
of its elements is always \(1\). Initially, the weights should
all be set to the same value: \(1 / n\).
The boosting algorithm works in steps or iterations. Each iteration proceeds as follows:
We double the weight of mislabeled inputs to force the algorithm to try harder to predict them correctly in future iterations.
Given a sample (i.e. an \(m\)-dimensional integer array
corresponding to a new transaction summary) to make a prediction
on, the boosted model should output the majority vote over
the predictions given by the weak learner created in each
iteration. This means you should use each weak learner
created in each iteration to label the sample point, and then
output the label that was predicted most often. In case of a tie,
output 0. Note that a sample needs to be reduced before you
can apply the model.
Boosting Algorithm. Implement a mutable data type BoostingAlgorithm
with the following API:
public class BoostingAlgorithm {

    // create the clusters and initialize your data structures
    public BoostingAlgorithm(int[][] input, int[] labels, Point2D[] locations, int k)

    // return the current weight of the ith point
    public double weightOf(int i)

    // apply one step of the boosting algorithm
    public void iterate()

    // return the prediction of the learner for a new sample
    public int predict(int[] sample)

    // unit testing
    public static void main(String[] args)
}
Corner cases.
Throw an IllegalArgumentException if:
null.input[][], labels[], locations[]
or sample[] are incompatible.input[][] is zero.labels[] are not all either 0 or 1.Unit testing. You don't need to create unit
tests. We provide you with some code to help you test
your BoostingAlgorithm.java implementation. See the section on
"Using the learners" below.
Performance requirements. Your implementation must achieve the following performance requirements:
weightOf() should run in \(\Theta(1)\) time.predict() should call the
WeakLearner's predict() method \(T\) times and the
Clustering's reduceDimensions() method once, where
\(T\) is the number of iterations performed so far.iterate() should create one WeakLearner object and then take \(O(n)\) time.Clustering object and then run in \(O(nm)\) time.A typical strategy for testing machine learning models is to partition labeled data into two data sets: a training and a test data set. The model is trained using the training data, and then tested on the test data set. We assess the quality of the model using a very simple metric called accuracy: the fraction of correct predictions. This metric can be used on the training and/or test datasets.
We provide several files that have been pre-partitioned into
training and test data sets, named accordingly. Below is a
sample client to test the BoostingAlgorithm
model. It takes two filenames (training and test data set
files), an integer \(k\) (the number of clusters for
dimensionality reduction), and an integer \(T\) (the number of
iterations of the boosting algorithm) as command-line
arguments. It trains the model on the training data set and
calculates the accuracy in the training and test data sets. It
uses an additional data type DataSet that is provided
in the project folder.
public static void main(String[] args) {
   // read in the terms from a file
    DataSet training = new DataSet(args[0]);
    DataSet testing = new DataSet(args[1]);
    int k = Integer.parseInt(args[2]);
    int T = Integer.parseInt(args[3]);

    int[][] trainingInput = training.getInput();
    int[][] testingInput = testing.getInput();
    int[] trainingLabels = training.getLabels();
    int[] testingLabels = testing.getLabels();
    Point2D[] trainingLocations = training.getLocations();

    // train the model
    BoostingAlgorithm model = new BoostingAlgorithm(
            trainingInput, trainingLabels, trainingLocations, k
    );
    for (int t = 0; t < T; t++)
        model.iterate();

    // calculate the training data set accuracy
    double trainingAccuracy = 0;
    for (int i = 0; i < training.getN(); i++)
        if (model.predict(trainingInput[i]) == trainingLabels[i])
            trainingAccuracy += 1;
    trainingAccuracy /= training.getN();

    // calculate the test data set accuracy
    double testingAccuracy = 0;
    for (int i = 0; i < testing.getN(); i++)
        if (model.predict(testingInput[i]) == testingLabels[i])
            testingAccuracy += 1;
    testingAccuracy /= testing.getN();

    StdOut.println("Training accuracy of model: " + trainingAccuracy);
    StdOut.println("Test accuracy of model: " + testingAccuracy);
}
To help you test your code, we provide two data sets, one
called princeton_training.txt
and one
called princeton_test.txt. Both
use the locations from the map described in the beginning of the
assignment, with inputs and labels were generated by a
simulation. Here is one example run of the above client on the reference
implementation of BoostingAlgorithm:
~/Desktop/fraud> java-algs4 BoostingAlgorithm princeton_training.txt princeton_test.txt 5 80
Training accuracy of model: 0.9625
Test accuracy of model:     0.7375
Note: Your code might have slightly different
accuracy values depending on how your weak learner implementation
tie-breaks between decision stumps with the same accuracy.
The training accuracy should be
around 0.95 and the test accuracy should be
around 0.7.
Use this testing framework to run
experiments and document them in the readme.txt (the file contains more
details on what you should do).
Submission.
Submit only Clustering.java, WeakLearner.java and BoostingAlgorithm.java.
We will supply algs4.jar.
You may not call library functions except those in
those in java.lang, java.util, and algs4.jar.
Finally, submit readme.txt
and acknowledgments.txt
files and answer the questions.
Grading.
file points Clustering.java8 WeakLearner.java20 BoostingAlgorithm.java8 readme.txt4 40
Reminder: You can lose up to 4 points
for breaking style principles and up to 3
points for not implementing the Clustering test.