
|
|
COS 429 - Computer Vision |
Fall 2011 |
| Course home | Outline and lecture notes | Assignments |
Princeton has a site license of Matlab, so you can install it on your own matchine - instructions are here.
Alternatively, Matlab is available on several OIT machines (look here for details). You should be able run it remotely from any Unix workstation.
Read through the following for a basic introduction to Matlab:
Work through the following tasks using an image of your choice. You do not need to submit any results, but make sure you are comfortable doing the following:
Note: if your version of Matlab doesn't have the rgb2gray function, download rgb2gray.m. Place this in your working directory, and it should be auto-loaded by Matlab.
matrix2 = matrix1(row_min:row_max,col_min:col_max);row_max or col_max may be "end" to indicate the last element.
[var1, var2] = func(x)Hint #3: In Matlab, the number of rows is the first dimension and the number of columns is the second.
If you get stuck on any of these, ask for help on piazza.
Background reading: See the slides on edge and feature detection, Sections 4.1-4.3 of Trucco & Verri, and Chapter 4 of your textbook.
Implement the Canny edge detection algorithm, as described in class. This consists of three phases:
Test your alogrithm on images of your choosing, experimenting with
different values of the parameters sigma (the width of the Gaussian used
for smoothing), T_h (the "high" threshold), and T_l (the "low" threshold).
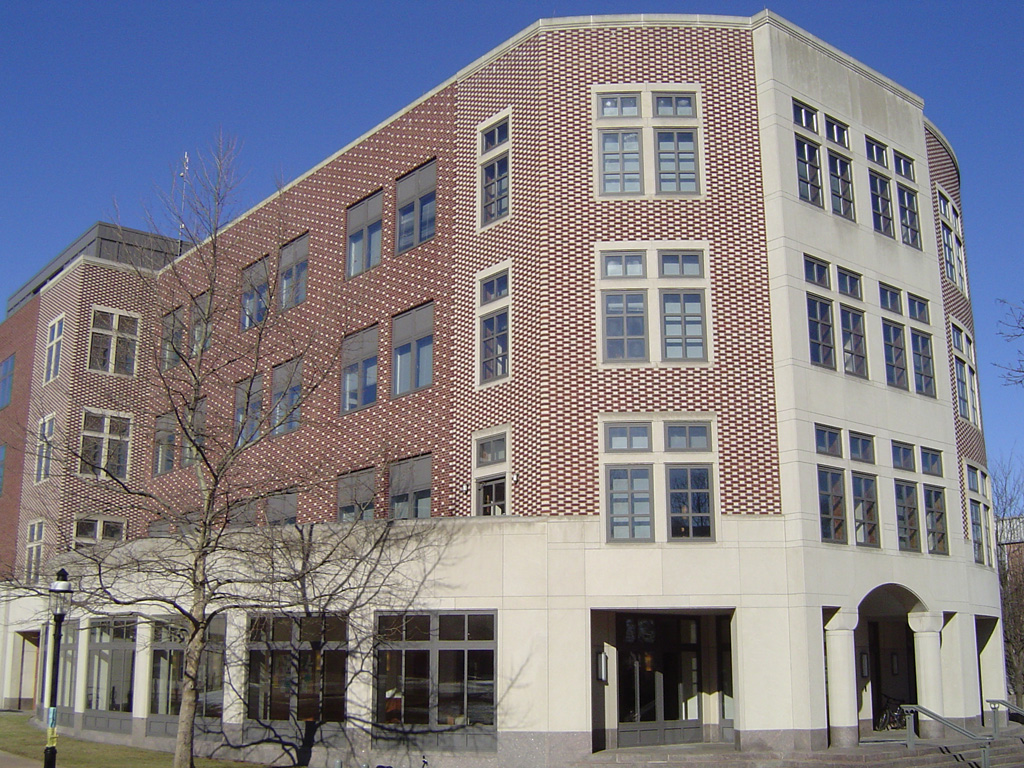
Also run your algorithm on the following images:
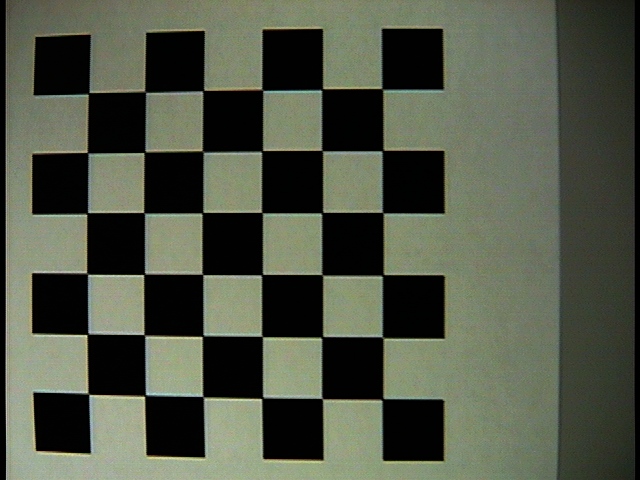
Test your algorithm on the building image above, and on
checker.jpg. (This is a picture of a
target used for camera calibration. Note the distortion in this lens - is
it barrel or pincushion?) Explore the effects of changing sigma (the width
of the Gaussian), the size of the neighborhood, and the threshold.
Find features that are maxima of a Difference of Gaussians (DoG), over scale
and position:
Test your algorithm on an image of your choice.
Experiment with heuristics for automatically determining the thresholds to
be used for each image. Some of these are mentioned in Trucco and Verri,
but feel free to be creative and come up with your own.
This assignment is due Tuesday, October 4, 2011 at 11:59 PM.
Please see the general
notes on submitting your assignments, as well as the
late policy and the
collaboration policy.
Please submit a single .zip file containing:
The Dropbox link to submit the assignment is
here.
Note that programming in Matlab is not an excuse to write unreadable code.
You are expected to use good programming style, including meaningful variable
names, a comment or three describing what the code is doing, etc. Also, all
images created by your code must be saved with the "imwrite" function - do
not submit screen captures of the image window.
2. Corner detector (25%)
Implement the variance-based corner detection algorithm, as described in
class. This consists of three phases:
Hint: "help eig"
Hint: "help sortrows"
3. Scale selection or "blob detection" (25%)
4. Extra credit (max 5% extra)
Submitting
Last update
13-Oct-2011 14:41:30
smr at princeton edu