Write a program to estimate the value of the percolation threshold via Monte Carlo simulation.
Install the Std* libraries. Download and install StdDraw.java, StdIn.java, StdOut.java, StdRandom.java, and StdStats.java.
Percolation. Given a composite systems comprised of randomly distributed insulating and metallic materials: what fraction of the materials need to be metallic so that the composite system is an electrical conductor? Given a porous landscape with water on the surface (or oil below), under what conditions will the water be able to drain through to the bottom (or the oil to gush through to the surface)? Scientists have defined an abstract process known as percolation to model such situations.
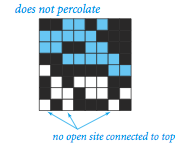
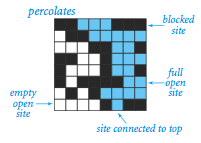
The model. We model a percolation system using an N-by-N grid of sites. Each site is either open or blocked. Open sites are initially empty; a full site is an open site that can be connected to an open site in the top row via a chain of neighboring (left, right, up, down) open sites. We say the system percolates if there is a full site in the bottom row. In other words, a system percolates if we fill all open sites connected to the top row and that process fills some open site on the bottom row. (For the insulating/metallic materials example, the open sites correspond to metallic materials, so that a system that percolates has a metallic path from top to bottom, with full sites conducting. For the porous substance example, the open sites correspond to empty space through which water might flow, so that a system that percolates lets water fill open sites, flowing from top to bottom.)
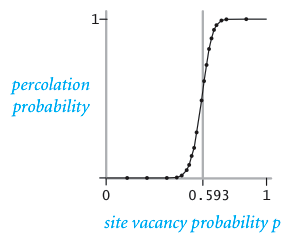
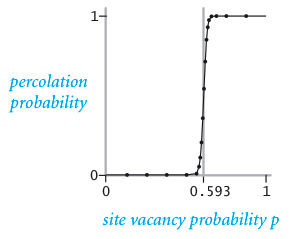
The problem. In a famous scientific problem, researchers are interested in the following question: if sites are independently set to be open with probability p (and therefore blocked with probability 1 - p), what is the probability that the system percolates? When p is 0, the system does not percolate; when p is 1, the system percolates. The plots below show the site vacancy probability p versus the percolation probability for 20-by-20 random grid (left) and 100-by-100 random grid (right).
| 
| ||
When N is sufficiently large, there is a threshold value p* such
that when p < p* a random Monte Carlo simulation.
The program
PercolationDFS.java
is your starting point.
(See Section 2.4 of Introduction to Programming in Java.)
It has the following API:
Visualization.
The client program
PercolationVisualizer.java
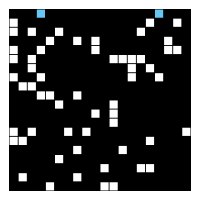
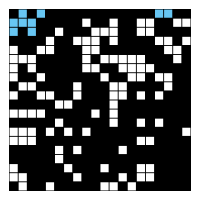
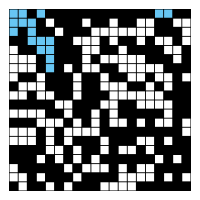
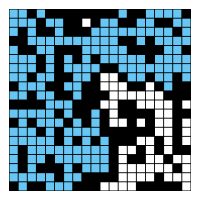
animates the simulation by displaying full sites in cyan,
open sites in white, and blocked sites in black, as in this
movie and the snapshots below.
This visualization serves as a large-scale trace.
Knowing that it works properly for a 20-by-20 grid gives us some confidence
that it works for a 100-by-100 grid.
Computational experiments.
Your first task is to use the client program
PercolationStats.java
to run experiments and produce an estimate for the percolation
threshold. The program takes two command-line arguments N and T,
performs T independent experiments on an N-by-N grid,
and prints out a 95% confidence interval for the percolation
threshold.
The more experiments you perform, the more accurate the results.
The following statistical test quantifies this effect.
Let xt be the fraction of open sites in experiment t.
The mean μ provides an unbiased estimate of the percolation threshold.
The standard deviation σ measures the sharpness of the threshold.
Estimate the percolation threshold for a 100-by-100 grid by performing as many
experiments as you can in 1 minute on your computer.
How accurate (width of confidence interval) is you estimate?
How accurate would your estimate be if given 1 day of computation time?
If given 1 year?
How does doubling N affect the running time?
How does doubling T affect the running time?
Give a formula of the running time on your computer (in seconds) as a function of
N and T.
You may use Stopwatch.java to
measure running time.
Union-find implementations.
The depth-first search based connectivity algorithm is too slow when
N is moderately large because it begins the search
from scratch after each new site is declared open.
Your main task is to create a program PercolationUF.java
that significantly speeds up the connectivity computation by
using one of the union-find data structures from lecture:
QuickU.java,
QuickFind.java,
QuickUW.java,
or
QuickUWPC.java.
Which is fastest? Why? Which is slowest? Why?
Estimate the percolation threshold for a 100-by-100 grid by performing as many
experiments as you can in 1 minute on your computer.
How accurate is you estimate?
How accurate would your estimate be if given 1 day of computation time?
If given 1 year?
How does doubling N affect the running time?
How does doubling T affect the running time?
Give a formula of the running time on your computer (in seconds) as a function of
N and T.
Also, give a formula for the amount of memory (in bytes)
that your program uses as a function of N.
Deliverables.
Submit your fastest version of PercolationUF.java.
(Don't submit any other .java files.)
Your program should implement exactly the same API as PercolationDFS.
Also, submit a
readme.txt file, answering all questions.
The key method percolates() uses
the depth-first search algorithm to detect connectivity.
public class PercolationDFS {
   public PercolationDFS(int N)   // create N-by-N grid, will all sites empty
   public void    step()          // declare a new site (at random) to be open
   public boolean percolates()    // does the system percolate?
   public void    draw()          // draw the system on standard draw
}
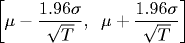
Assuming T is sufficiently large (say, at least 30), a 95% confidence interval for
the percolation threshold is given by:

Copyright © 2008.