


COS 341, October 8, 1997Handout Number 8
About Polling
Consider an upcoming election in a large metropolitan area, with a
large voting population. Two candidates A and B are running.
If you are a pollster, taking a random sample of size n (n is
a moderate number compared with the population). How confident are
you about the result you get? If your result has m votes for
A, how do you decide on  so that you can say that
``the result is m/n for A, (n-m)/n for B, with
a margin of error of ''?
so that you can say that
``the result is m/n for A, (n-m)/n for B, with
a margin of error of ''?
You can fairly accurately model your polling as follows. Let 0<p<1 be the true fraction of voters for A. Throw a biased (with bias p for HEAD and 1-p for TAIL) coin n times. The HEADs are for A and TAILs are for B. Let X denote the random variable corresponding to the total number of HEADs.
You polling corresponds to making an observation of
the value of X, say with result m. By Chebyshev's Inequality,
m is likely to be within a
few standard deviations of the expected value
of X. That means in turn that pn (which is E(X))
is within a few standard deviation of m.
That is, pn is within  of m.
Hence p is within
of m.
Hence p is within  of your polling
result m/n.
of your polling
result m/n.
It is easy to calculate  . Clearly,
 .
The generating function
.
The generating function  ,
which is equal to
,
which is equal to 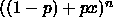 by the Binomial Theorem.
It follows that
by the Binomial Theorem.
It follows that  and
and
 . From this, we
obtain
. From this, we
obtain  .
This leads to
.
This leads to  .
Now,
.
Now,  (?? Can you prove it?). Thus,
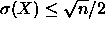 . Thus,
from the discussions in the
last paragraph, it is reasonable
to say that your polling result has a margin of
error about
. Thus,
from the discussions in the
last paragraph, it is reasonable
to say that your polling result has a margin of
error about  .
.