Re-affirm the atomic nature of matter by tracking the motion of particles undergoing Brownian motion, fitting this data to Einstein's model, and estimating Avogadro's number.
Historical perspective. The atom played a central role in 20th century physics and chemistry, but prior to 1908 the reality of atoms and molecules was not universally accepted. In 1827, the botanist Robert Brown observed the random erratic motion of microscopic particles suspended within the vacuoles of pollen grains. This motion would later become known as Brownian motion. Einstein hypothesized that this motion was the result of millions of even smaller particles—atoms and molecules—colliding with the larger particles.
In one of his "miraculous year" (1905) papers, Einstein formulated a quantitative theory of Brownian motion in an attempt to justify the "existence of atoms of definite finite size." His theory provided experimentalists with a method to count molecules with an ordinary microscope by observing their collective effect on a larger immersed particle. In 1908 Jean Baptiste Perrin used the recently invented ultramicroscope to experimentally validate Einstein's kinetic theory of Brownian motion, thereby providing the first direct evidence supporting the atomic nature of matter. His experiment also provided one of the earliest estimates of Avogadro's number. For this work, Perrin won the 1926 Nobel Prize in physics.
The problem. In this assignment, you will redo a version of Perrin's experiment. Your job is greatly simplified because with modern video and computer technology—in conjunction with your programming skills—it is possible to accurately measure and track the motion of an immersed particle undergoing Brownian motion. We supply video microscopy data of polystyrene spheres ("beads") suspended in water, undergoing Brownian motion. Your task is to write a program to analyze this data, determine how much each bead moves between observations, fit this data to Einstein's model, and estimate Avogadro's number.
The data. We provide 10 datasets, obtained by William Ryu using fluorescent imaging. Each dataset is stored in a subdirectory (named run_1 through run_10) and contains a sequence of two hundred 640-by-480 color JPEG images (named frame00000.jpg through frame00199.jpg).
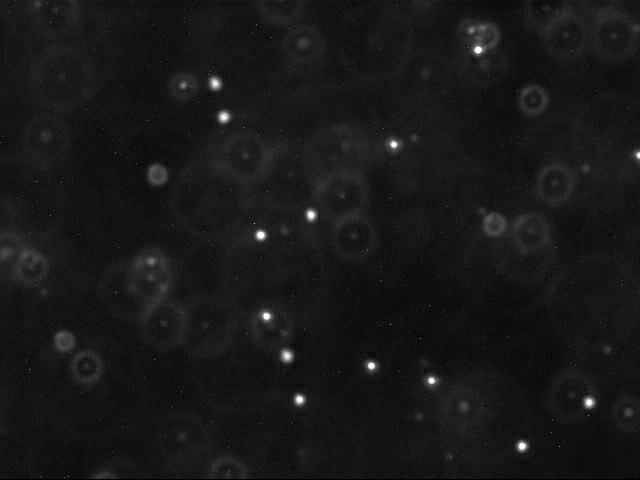
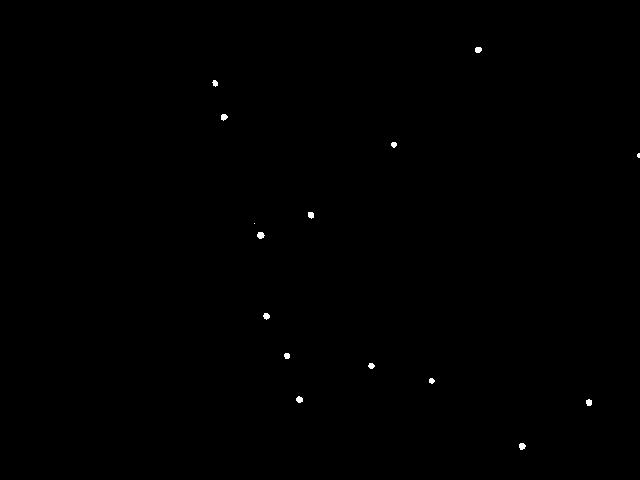
Here is a movie [ avi · mov ] of several beads undergoing Brownian motion. Below is a typical raw image (left) and a cleaned up version (right) using thresholding, as described below.
Each image shows a two-dimensional cross section of a microscope slide. The beads move in and out of the microscope's field of view (the x- and y-directions). Beads also move in the z-direction, so they can move in and out of the microscope's depth of focus; this results in halos, and it can also result in beads completely disappearing from the image.
I. Particle identification. The first challenge is to identify the beads amidst the noisy data. Each image is 640-by-480 pixels, and each pixel is represented by a Color object which needs to be converted to a luminance value ranging from 0.0 (black) to 255.0 (white). Whiter pixels correspond to beads (foreground) and blacker pixels to water (background). We break the problem into three pieces: (i) read an image, (ii) classify the pixels as foreground or background, and (iii) find the disc-shaped clumps of foreground pixels that constitute each bead.
Create a helper data type Blob that has the following API.
public class Blob {
    public        Blob()                     //  creates an empty blob
    public   void add(int x, int y)          //  adds pixel (x, y) to this blob
    public   int  mass()                     //  returns the number of pixels added to this blob
    public double distanceTo(Blob that)      //  returns the Euclidean distance between the center of masses of the two blobs
    public String toString()                 //  returns a string representation of this blob (see below)
    public static void main(String[] args)   //  unit tests all methods in the Blob data type
}
String representation. The toString() method should return a string containing the blob's mass; followed by whitespace; followed by the x- and y-coordinates of the blob's center of mass, enclosed in parentheses, separated with a comma, and using four digits of precision after the decimal point.
Next, write a data type BeadFinder that has the following API. Use depth-first search to efficiently identify the blobs and beads.
public class BeadFinder {
    //  finds all blobs in the specified picture using luminance threshold tau
    public BeadFinder(Picture picture, double tau)

    //  returns all beads (blobs with >= P pixels)
    public Blob[] getBeads(int P)

    //  unit tests the BeadFinder data type, as described below
    public static void main(String[] args)
}
The main() method should take an integer P,
a floating-point number tau,
and the name of a JPEG file as command-line arguments; create
a BeadFinder object using a luminance threshold of tau;
and and print all beads (blobs containing at least P pixels),
as shown here:
In the sample frame, there are 15 blobs, 13 of which are beads.% java-introcs BeadFinder 0 180.0 run_1/frame00001.jpg 29 (214.7241, 82.8276) 36 (223.6111, 116.6667) 1 (254.0000, 223.0000) 42 (260.2381, 234.8571) 35 (266.0286, 315.7143) 31 (286.5806, 355.4516) 37 (299.0541, 399.1351) 35 (310.5143, 214.6000) 31 (370.9355, 365.4194) 28 (393.5000, 144.2143) 27 (431.2593, 380.4074) 36 (477.8611, 49.3889) 38 (521.7105, 445.8421) 35 (588.5714, 402.1143) 13 (638.1538, 155.0000) % java-introcs BeadFinder 25 180.0 run_1/frame00001.jpg 29 (214.7241, 82.8276) 36 (223.6111, 116.6667) 42 (260.2381, 234.8571) 35 (266.0286, 315.7143) 31 (286.5806, 355.4516) 37 (299.0541, 399.1351) 35 (310.5143, 214.6000) 31 (370.9355, 365.4194) 28 (393.5000, 144.2143) 27 (431.2593, 380.4074) 36 (477.8611, 49.3889) 38 (521.7105, 445.8421) 35 (588.5714, 402.1143)
II. Particle tracking. The next step is to determine how far a bead moves from one time step t to the next t + Δt. For our data, Δt = 0.5 seconds per frame. We assume the data is such that each bead moves a relatively small amount, and that two beads do not collide. (We must, however, account for the possibility that the bead disappears from the frame, either by departing the microscope's field of view in the x- or y- direction, or moving out of the microscope's depth of focus in the z-direction.) Thus, for each bead at time t + Δt, we calculate the closest bead at time t (in Euclidean distance) and identify these two as the same bead. However, if the distance is too large—greater than delta pixels—we assume that one of the beads has either just begun or ended its journey. We record the displacement that each bead travels in the Δt units of time.
Write a main() method in BeadTracker.java that takes an integer P, a double value tau, a double value delta, and a sequence of JPEG filenames as command-line arguments, identifies the beads (using the specified values of P and tau) in each JPEG image (using BeadFinder), and prints the radial displacement that each bead moves from one frame to the next (assuming it is no more than delta).
Hint: do not explicitly track a bead through a sequence of frames; you should worry about identifying the same bead only in two consecutive frames.% java-introcs BeadTracker 25 180.0 25.0 run_1/*.jpg 7.1833 4.7932 2.1693 5.5287 5.4292 4.3962 ...
III. Data analysis. Einstein's theory of Brownian motion connects microscopic properties (e.g., radius, diffusivity) of the beads to macroscopic properties (e.g., temperature, viscosity) of the fluid in which the beads are immersed. This amazing theory enables us to estimate Avogadro's number with an ordinary microscope by observing the collective effect of millions of water molecules on the beads.
For our data, Δt = 0.5 so our estimate for σ2 is an estimate for D as well.
Note that the radial displacements in the formula above are measured in meters. The radial displacements output by your BeadTracker program are measured in pixels. To convert from pixels to meters, multiply by 0.175 × 10⁻⁶ (meters per pixel).
and k is the Boltzmann constant. All parameters are given in SI units. The Boltzmann constant is a fundamental physical constant that relates the average kinetic energy of a molecule to its temperature. We estimate k by measuring all of the parameters in the Stokes–Einstein equation, and solving for k.
For the final part, write a main() method in Avogadro.java that reads the displacements from standard input and estimates Boltzmann's constant and Avogadro's number using the formulas described above.
% more displacements-run_1.txt        % java-introcs BeadTracker 25 180.0 25.0 run_1/*.jpg | java-introcs Avogadro
 7.1833                               Boltzmann = 1.2535e-23
 4.7932                               Avogadro  = 6.6329e+23
 2.1693
 5.5287
 5.4292
 4.3962
...

% java-introcs Avogadro < displacements-run_1.txt
Boltzmann = 1.2535e-23
Avogadro  = 6.6329e+23
Output format. Use four digits of precision after the decimal point, both in BeadTracker and Avogadro.
Running-time analysis. Formulate a hypothesis for the running time (in seconds) of BeadTracker as a function of the input size N (total number of pixels read in across all frames being processed). Justify your hypothesis in your readme.txt file with empirical data.
Provided files. You can download the datasets and other helper files as atomic.zip (67 MB).
Submission. Submit Blob.java, BeadFinder.java, BeadTracker.java and Avogadro.java. You may assume access to stdlib.jar, Luminance.java, Stack.java, Queue.java, and ST.java. Finally, submit a readme.txt file (or partner readme file) and answer the questions, including the running-time analysis.