Write a program to estimate the value of the percolation threshold via Monte Carlo simulation.
Install our standard libraries. Download and install stdlib.jar from the bottom of this page. This contains libraries for reading data from standard input, writing data to standard output, drawing results to standard draw, generating random numbers, computing statistics, and timing programs.
Percolation. Given a composite systems comprised of randomly distributed insulating and metallic materials: what fraction of the materials need to be metallic so that the composite system is an electrical conductor? Given a porous landscape with water on the surface (or oil below), under what conditions will the water be able to drain through to the bottom (or the oil to gush through to the surface)? Scientists have defined an abstract process known as percolation to model such situations.
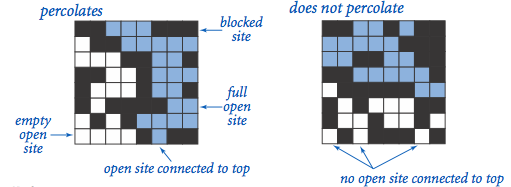
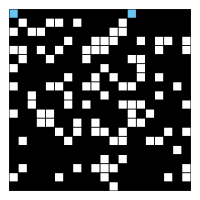
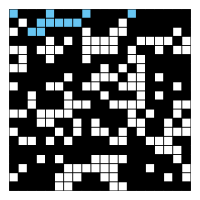
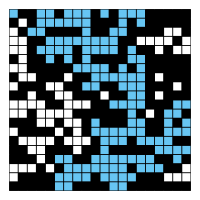
The model. We model a percolation system using an N-by-N grid of sites. Each site is either open or blocked. A full site is an open site that can be connected to an open site in the top row via a chain of neighboring (left, right, up, down) open sites. We say the system percolates if there is a full site in the bottom row. In other words, a system percolates if we fill all open sites connected to the top row and that process fills some open site on the bottom row. (For the insulating/metallic materials example, the open sites correspond to metallic materials, so that a system that percolates has a metallic path from top to bottom, with full sites conducting. For the porous substance example, the open sites correspond to empty space through which water might flow, so that a system that percolates lets water fill open sites, flowing from top to bottom.)
The problem. In a famous scientific problem, researchers are interested in the following question: if sites are independently set to be open with probability p (and therefore blocked with probability 1 − p), what is the probability that the system percolates? When p is 0, the system does not percolate; when p is 1, the system percolates. The plots below show the site vacancy probability p versus the percolation probability for 20-by-20 random grid (left) and 100-by-100 random grid (right).
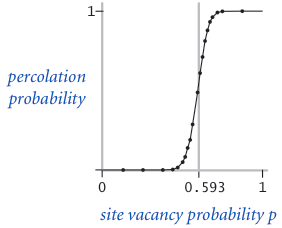
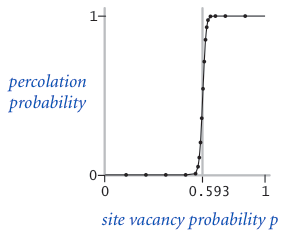
When N is sufficiently large, there is a threshold value p* such that when p < p* a random N-by-N grid almost never percolates, and when p > p*, a random N-by-N grid almost always percolates. No mathematical solution for determining the percolation threshold p* has yet been derived. Your task is to write a computer program to estimate p*.
Percolation data type. To model a percolation system, create a data type with the following API.
public class Percolation {
   public Percolation(int N)              // create N-by-N grid, with all sites blocked
   public void open(int i, int j)         // open site (row i, col j) if it is not already
   public boolean isOpen(int i, int j)    // is site (row i, col j) open?
   public boolean isFull(int i, int j)    // is site (row i, col j) full?
   public boolean percolates()            // does the system percolate?
}
Use the union-find data structure (as described and implemented
in lecture) to efficiently implement the Percolation data type.
By convention, the indices i and j
are integers between 1 and N, where (1, 1) is the upper-left cell:
Throw an exception if either i or j is outside this range.
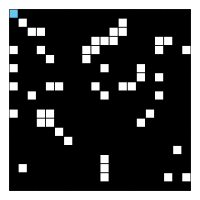
Visualization. Once you have implemented the API above, write a client program PercolationVisualizer.java to perform the following visualization:
% more input20.txt
20
  7  11
 18  11
 12   5
  9   5
  5   9
...

% java PercolationVisualizer < input20.txt
| 
| 
| 
|
This visualization serves as a large-scale trace. Knowing that it works properly for a 20-by-20 grid gives us some confidence that it works for a 100-by-100 grid.
Monte Carlo simulation. To estimate the percolation threshold, perform the following computational experiment:
To obtain an accurate estimate of the percolation threshold, repeat the experiment T times and average the results. Let xt be the fraction of open sites in experiment t. The sample mean μ provides an estimate of the percolation threshold. The sample standard deviation σ measures the sharpness of the threshold.
Assuming T is sufficiently large (say, at least 30), the following provides a 95% confidence interval for the percolation threshold:
Write a client program PercolationStats.java that takes two command-line arguments N and T, performs T independent experiments on an N-by-N grid, and prints out the 95% confidence interval for the percolation threshold. Use standard random from our standard libraries to generate random numbers; use standard statistics to compute the sample mean and standard deviation.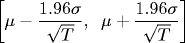
% java PercolationStats 200 100
mean percolation threshold  = 0.5920965000000004
stddev                      = 0.009811413646870666
95% confidence interval     = [0.5901734629252137, 0.594019537074787]

total time                  = 2.074
mean time per experiment    = 0.02073999999999999
stddev                      = 0.0037646248153036512
Analysis. Implement Percolation.java using the quick-find algorithm (QuickFindUF.java). How does doubling N affect the running time? How does doubling T affect the running time? Give a formula (using tilde notation) of the running time on your computer (in seconds) as a function of both N and T. Use the stopwatch data type from our standard library to measure running time. Give a formula (using tilde notation) that describes the amount of memory (in bytes) that your program consumes as a function of N.
Now, implement Percolation.java using the weighted quick-union algorithm (WeightedQuickUnionUF.java). Answer the questions in the previous paragraph.
Deliverables. Submit Percolation.java (using the weighted quick-union algorithm), PercolationVisualizer.java, and PercolationStats.java. We will supply WeightedQuickUnionUF.java and stdlib.jar. Also, submit a readme.txt file, answering all questions. You will need to read the COS 226 Collaboration Policy in order to answer the related questions in your readme file.