2. Arrays and IO
Download Project Zip
| Submit to TigerFile
Goals
- To gain more experience using arrays and loops.
- To learn about reading input using the
StdInlibrary and printing output using theStdOutlibrary. - To learn about graphics and animation using the
StdDrawlibrary. - To learn about digital audio using the
StdAudiolibrary. - To learn about using the command-line to redirect standard input to read from a file.
Background
This assignment is based on the concepts and techniques described in Sections 1.4 and 1.5 of the textbook (and the corresponding lectures and precepts). You may also find it instructive to work through some of the other exercises and look at the solutions on the booksite afterwards.
Getting Started
-
Make sure you understand the lecture materials and the precept exercises before proceeding. Refer to the lecture and precept examples while you are coding.
-
Download and expand the zip file, which will create the folder
arrays. We recommend this folder be placed in acos126folder. -
Open the
arraysfolder (i.e., the project) in IntelliJ. -
Implement these programs:
DiceHistogram.javaEchoFilter.javaSoundWaveVisualizer.javaWorldMap.java
-
Recall: To create a new Java class files, use LIFT → New → Java Class.
-
Complete a
readme.txt.
Requirements
- You may not call library functions except those in
- You may not use Java features that have not yet been introduced in the course (such as functions).
Dice and the Gaussian Distribution
Write a program DiceHistogram.java that takes two command-line arguments: \(m\), the number of fair six-sided dice, \(n\), the number of times to roll them. Assume that \(0 \leq m \leq 100\) and \(n \geq 0\). Use an integer array to tabulate the number of times each possible total (between \(m\) and \(6 \times m\)) occurs. Then print a text histogram of the results.
Each histogram value should right-justified in a field width of three characters; followed by a colon; followed by a single space; followed by a sequence of asterisks corresponding to the number of times that value occurred as a sum.
For example, here are the results of an execution when (\(m = 2\) and \(n = 500\)):
> java-introcs DiceHistogram 2 500
  2: **************
  3: ***************************
  4: *********************************
  5: *************************************************************
  6: **********************************************************************
  7: ******************************************************************************
  8: ***********************************************************************
  9: **********************************************************
 10: **********************************************
 11: ****************************
 12: **************
Note - your results will likely be slightly different due the random rolls of the dice.
Here are the results of an execution when \(m = 10\) and n = \(1000\):
% java-introcs DiceHistogram 10 1000
 10:
 11:
 12:
 13:
 14:
 15:
 16:
 17:
 18: *
 19: ****
 20:
 21: ***
 22: ******
 23: ********
 24: ****************
 25: *************
 26: **********
 27: *********************************
 28: ****************************************
 29: *********************************
 30: ***************************************************
 31: *****************************************************************
 32: ********************************************************
 33: **************************************************************************************
 34: ***********************************************************
 35: *********************************************************************
 36: ***********************************************************************************
 37: **************************************************************
 38: *****************************************************************
 39: ***************************************
 40: *****************************************************
 41: ************************************
 42: ****************************
 43: ************************
 44: ************************
 45: *********
 46: ***********
 47: *******
 48: ***
 49: **
 50:
 51:
 52: *
 53:
 54:
 55:
 56:
 57:
 58:
 59:
 60:
Background: The central limit theorem, a key result in probability and statistics, asserts that the shape of the resulting histogram tends to the ubiquitous bell curve (Gaussian distribution) if the number of dice and rolls is large.
FAQs
Click on the ► icon to expand and the ▼ icon to hide each FAQ.
How do I print an integer right-justified in a field width of three characters?
Use formatted printing -StdOut.printf("%3d", i); For more information see Formatted printing.
I have the magic number 6 sprinkled through my DiceHistogram program. Is there a better way?
Yes! Define a constant variable (such as SIDES) and use this symbolic name to refer to the corresponding magic number.
Echo Filter
Consider what happens if you superpose a sound file with itself, but shifted over a specified number of samples. You’ll hear the same sound twice, the second time slightly delayed. If the delay is relatively short (say, 15,000 samples or about 1/3 of a second) and you decrease the loudness of the second copy (by multiplying the samples by a factor of, say, 0.5), it will result in an echo effect, much like you might hear in a tunnel or large empty room.
Recall from lecture that a sound wave is a mechancal wave and is subject to the principle of superposition. This means that to combine two (or more) sound waves, you simply add the corresponding samples together.
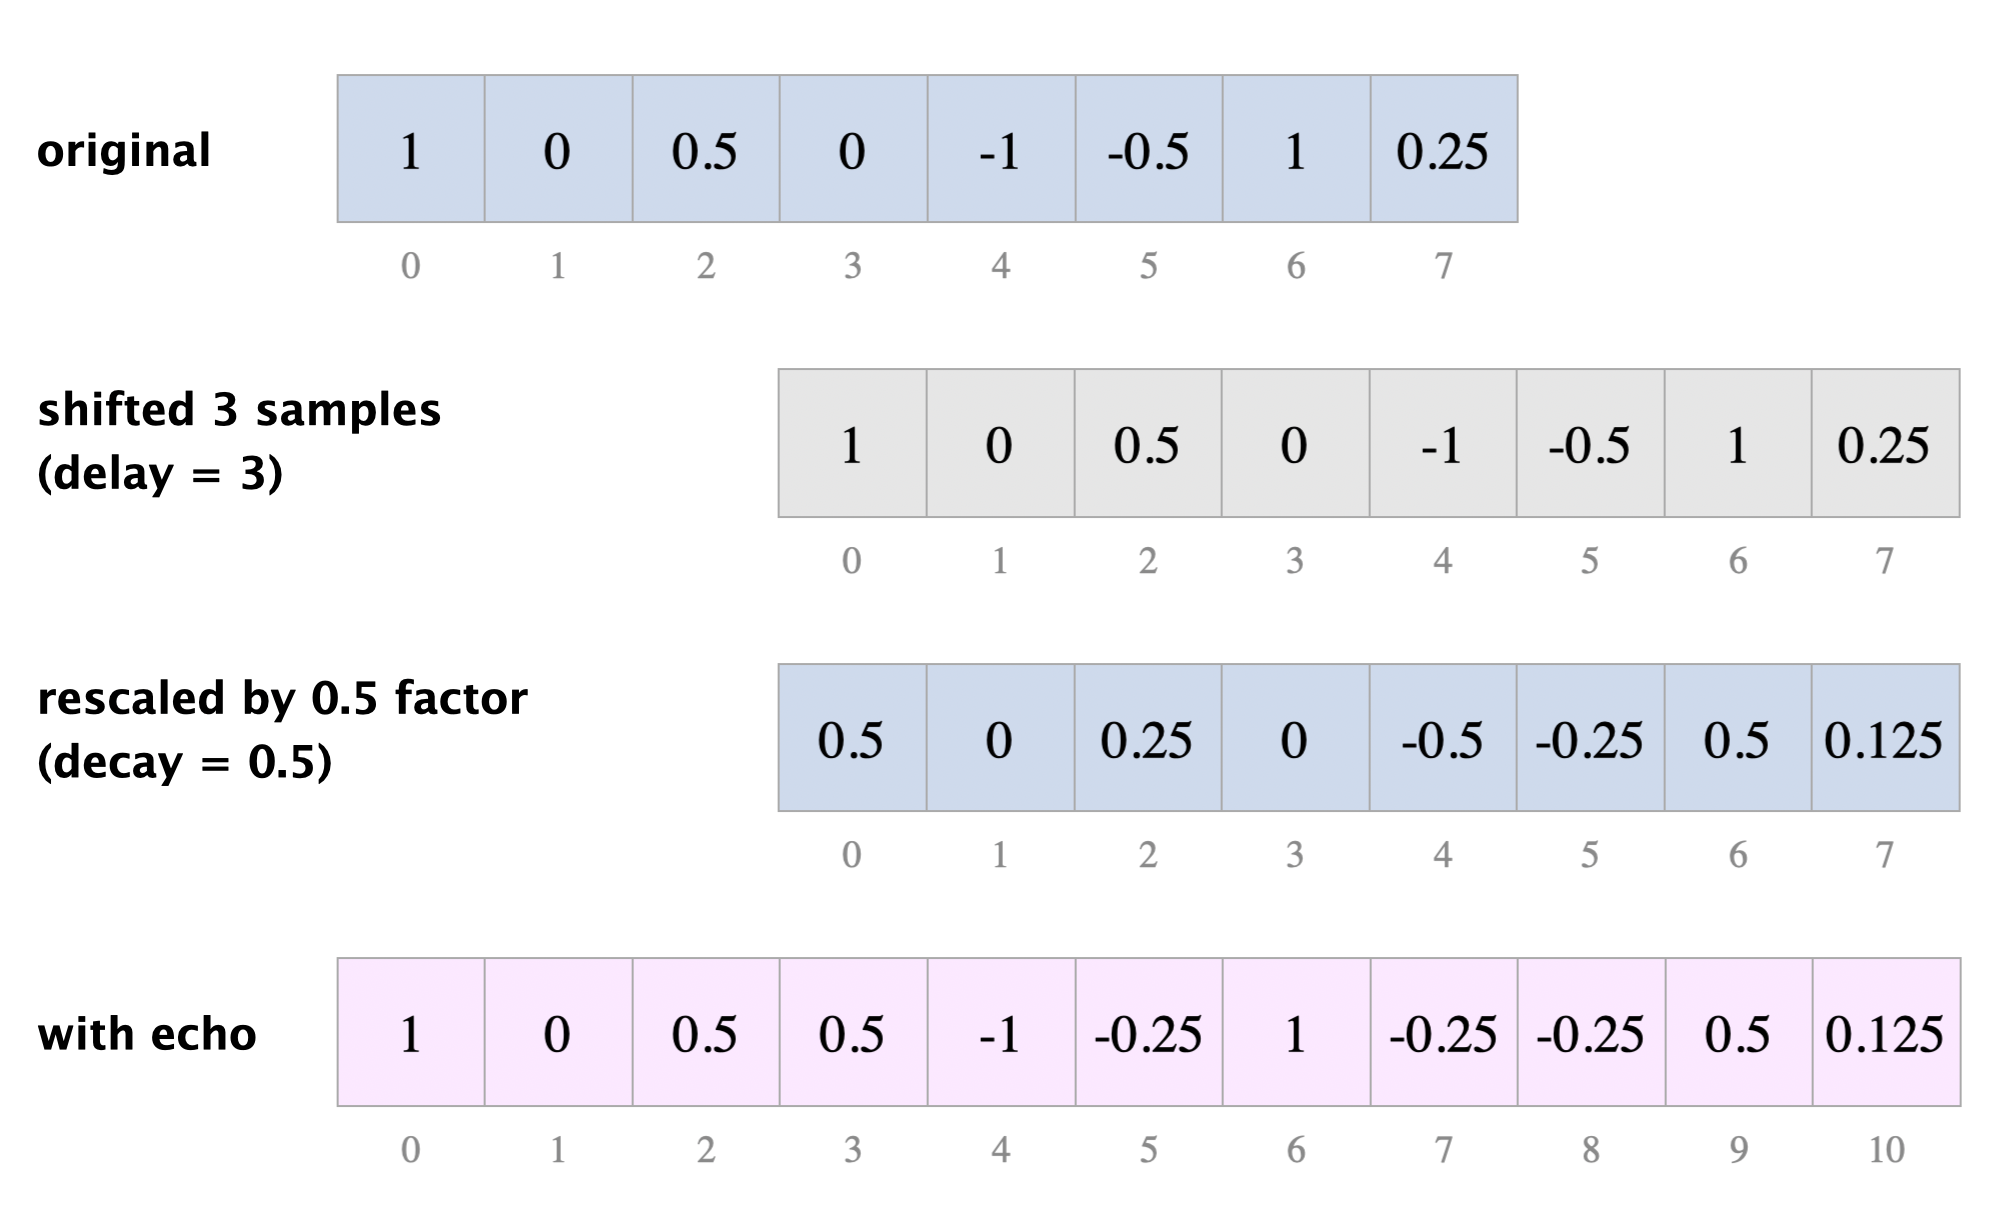
Write a program EchoFilter.java that takes three command-line arguments (a string filename, an integer delay, and a floating-point decay factor) and applies an echo filter to the given sound file. Note that the length of the resulting sound wave will be equal to the original length plus the delay.
Here are some sample executions:
> java-introcs EchoFilter IHaveADream.wav 0 0.0
> java-introcs EchoFilter IHaveADream.wav 15000 0.5
> java-introcs EchoFilter PearlHarbor.wav 15000 0.5
> java-introcs EchoFilter TheHillWeClimb.wav 10000 0.5
> java-introcs EchoFilter Crow.wav 10000 0.5
> java-introcs EchoFilter HelloWorld.wav 5000 1.0
> java-introcs EchoFilter RowYourBoat.wav 117600 1.0
An echo filter is popular voice effect that you can apply on social media platforms such as TikTok.
FAQs
Click on the ► icon to expand and the ▼ icon to hide each FAQ.
Can I assume that delay is a non-negative integer?
Yes. Though, some musicians have found uses for reverse echo effects, which correspond to negative delay parameters.Can I assume that decay is between 0 and 1?
Yes. We will test your program only with decay values between 0 and 1.The echo filter repeats the sound source only once. How could I get a repeating, decaying echo?
You could superpose several copies of the original sound source, with successive copies shifted over increasing amounts and at quieter volumes. Feel free to experiment with this idea.Sound Wave Visualizer
With digital audio, we model a sound wave as a sequence of real numbers between –1 and +1. In this exercise you will write a program to plot these values (using StdDraw) while playing the sound (using StdAudio), to produce a visualization like the following:
To produce the visualization, consider a sound wave and do the following:
-
Let \(n\) denote the number of audio samples (each between –1 and +1).
-
Let \(k\) be a parameter that specifies the number of groups. For now, assume \(n\) is a multiple of \(k\).
-
Treat the \(n\) samples as being divided into \(k\) groups, with each group containing \(n / k\) successive samples, starting with sample 0.
-
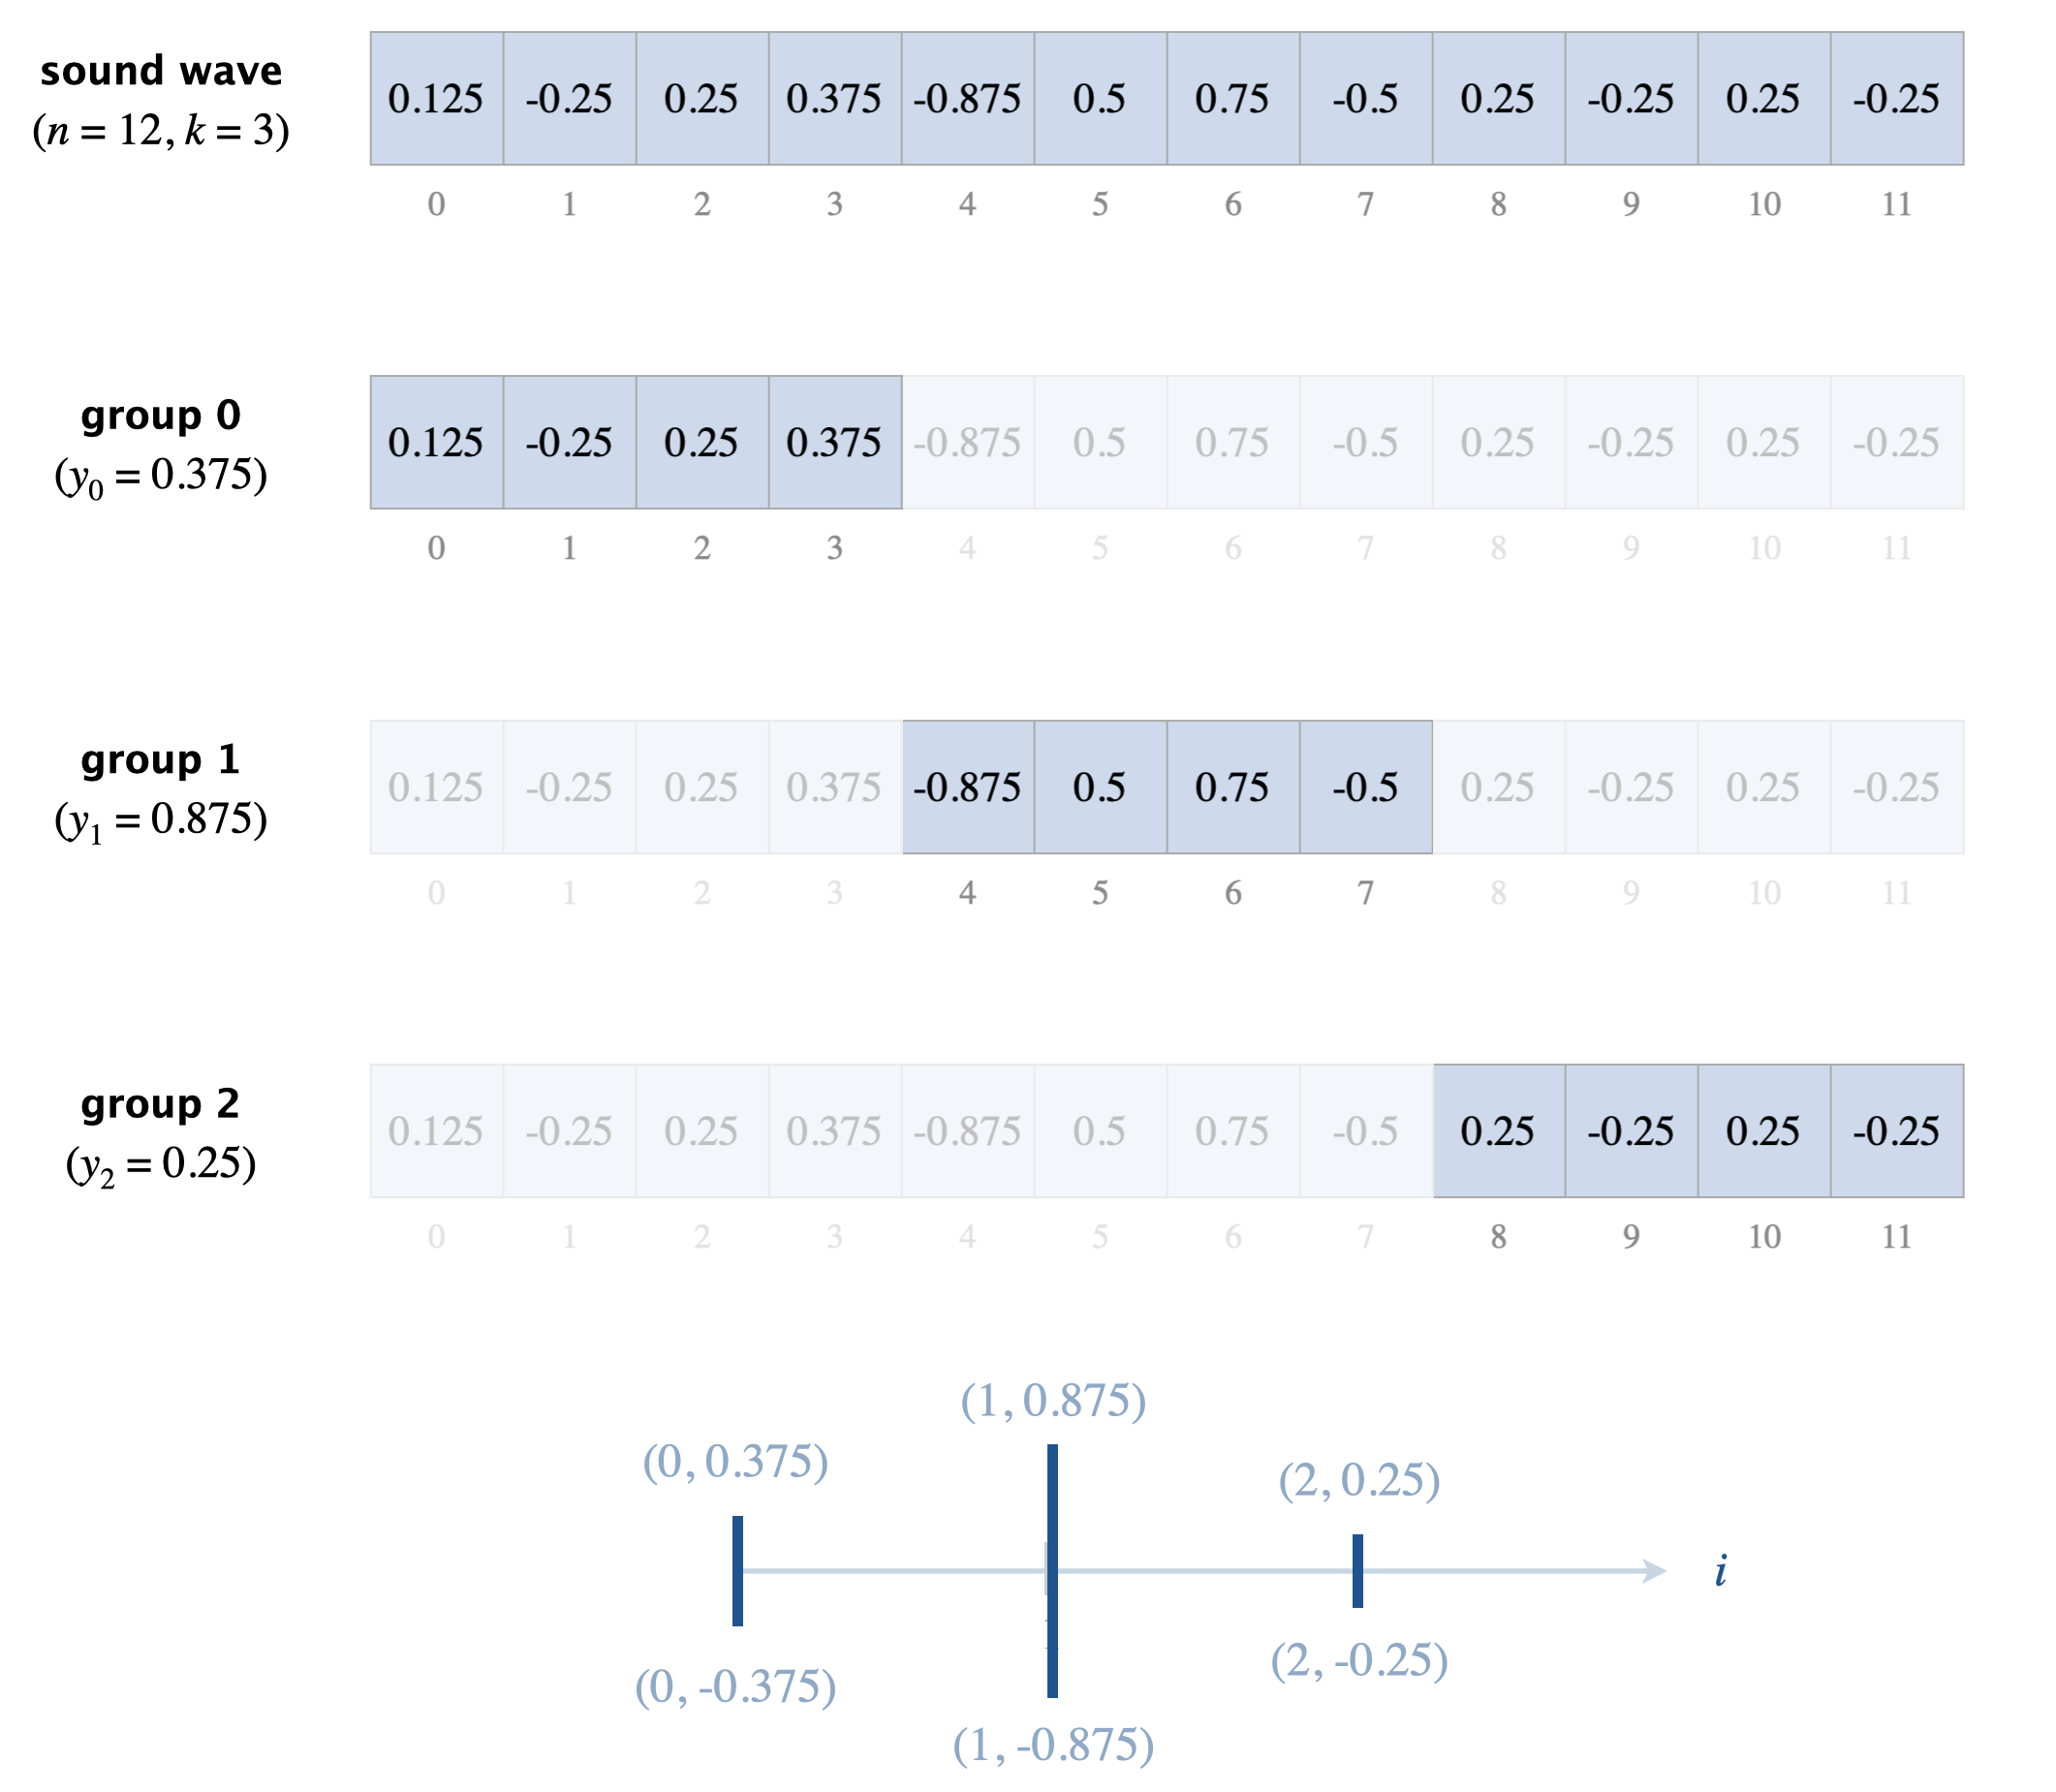
For each group \(i\):
- Identify the largest magnitude (absolute value) of any sample in the group and let \(y_i\) denote that value.
- Plot a vertical line segment between \((i, y_i)\) and \((i, −y_i)\).
Here is a tiny example with \(n = 12\) samples and \(k = 3\) groups:
Write a program SoundWaveVisualizer.java that takes two command-line arguments (the name of an audio file and an integer \(k\) for the number of groups) and plots the sound wave using the method described above. Additionally, as you process each individual sample in group \(i\), play it using StdAudio.play(sample). That way, the visualization will be in sync with the audio.
-
Set the canvas size to 1000-by-100 pixels by calling
StdDraw.setCanvasSize(1000, 100). This will make the window have a wide aspect ratio, suitable for visualizing sound waves. -
Set the range of the \(x\)-coordinates to be between \(–1\) and \(k\) by calling
StdDraw.setXscale(-1, k)and set the range of the \(y\)-coordinates to be between \(–1\) and \(+1\) by callingStdDraw.setYscale(-1, +1). This will make the line segments fit snugly in the drawing window. -
Change the pen color to a shade of blue by calling
StdDraw.setPenColor(StdDraw.BOOK_BLUE). -
Play the individual samples in group \(i\) and then plot the line segment corresponding to group \(i\).
-
If \(n\) is not an exact multiple of \(k\), each group will have exactly \(\lfloor n/k\rfloor\) samples. Ignore the leftover samples.
Here are some sample executions:
java-introcs SoundWaveVisualizer tiny.wav 3

java-introcs SoundWaveVisualizer HelloWorld.wav 1000
java-introcs SoundWaveVisualizer PianoSonata11.wav 1000
java-introcs SoundWaveVisualizer IHaveADream.wav 1000
FAQs
Click on the ► icon to expand and the ▼ icon to hide each FAQ.
How can I calculate the elements of samples[] in group i?
If each group has groupSize samples, then the first element in group i is samples[i * groupSize] and the last element is samples[(i + 1) * groupSize - 1].
My program is slightly off when \(n\) is not a multiple of \(k\). It also produces an ArrayIndexOutOfBoundsException on longer sound files. Why might this be?
It could be a result of integer division and integer overflow. For example, the expression i * n / k for identifying the index of the first element in group i is not equivalent to i * (n / k). Moreover, the former expression is susceptible to integer overflow.
If \(k\) is very large, the sound and visualization are choppy. Why is this?
Drawing on the screen is an expensive operation (in terms of CPU time). If \(k = n\), then you would be attempting to redraw the standard drawing window 44,100 times per second. (For reference, many LCD monitors and video games have a refresh rate of 60 Hz, so you wouldn’t be able to detect redraws at a rate higher than 60 times per second.)Is this the actual algorithm used by various apps to visualize audio files?
Yes. It is known as the MinMax algorithm. The root mean square (RMS) algorithm is a popular competitor: instead of using the maximum absolute value of the samples in a group, it uses the square root of the sums of the squares of the samples in the group. You can also combine the two—plot the line segment for the MinMax in in dark blue and the line segment for RMS in light blue.World Maps
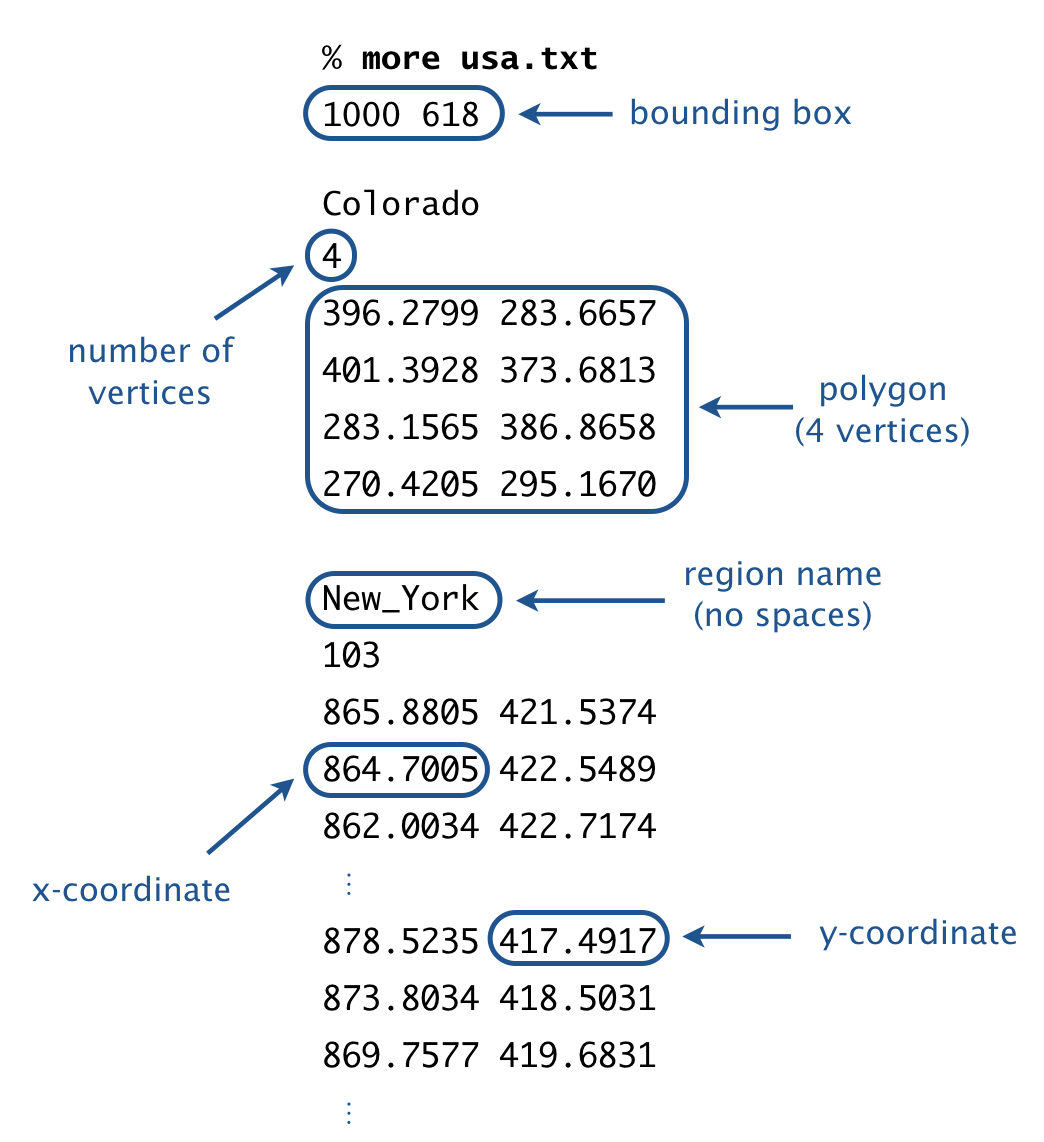
Write a program WorldMap.java that reads boundary information of a country (or other geographic entity) from standard input (using StdIn) and plots the results to standard drawing (using StdDraw). A country consists of a set of regions (e.g., states, provinces, or other administrative divisions), each of which is described by a polygon. A polygon will be represented by two floating-point arrays, one containing the \(x\)-coordinates and the other containing the \(y\)-coordinates of the vertices of the polygon.
Input format. The first line contains two integers: width and height. The remaining part of the input is divided into regions.
-
The first entry in each region is the name of the region. For simplicity, names will not contain spaces.
-
The next entry is an integer specifying the number of vertices in the polygon describing the region.
-
Finally, the region contains the \(x\)- and \(y\)-coordinates of the vertices of the polygon.
For simplicity, if a region requires more than one polygon to describe its boundary, we treat it as multiple regions, with one polygon per region.
Output format. Draw the polygons to standard drawing, using the following guidelines:
-
Call
StdDraw.setCanvasSize()to set the size of the canvas to be width-by-height pixels. -
Call
StdDraw.setXscale()andStdDraw.setYscale()so that \(x\)-coordinates of the canvas range from 0 to width and the \(y\)-coordinates range from 0 to height. -
Call
StdDraw.polygon()to draw each polygon. This method takes two arrays as arguments—the array of \(x\)-coordinates and the array of \(y\)-coordinates. It draws the polygon whose sequence of vertices is defined by those \(x\)- and \(y\)-coordinates.
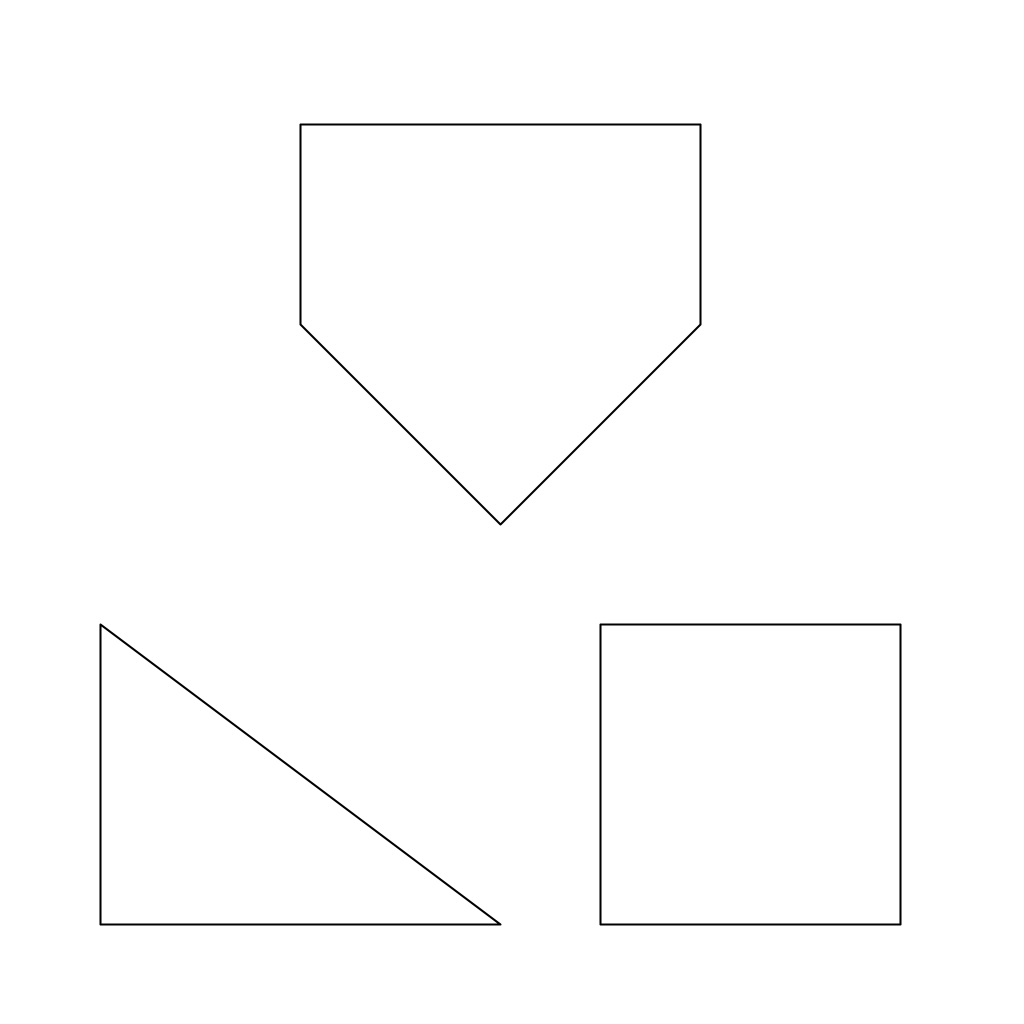
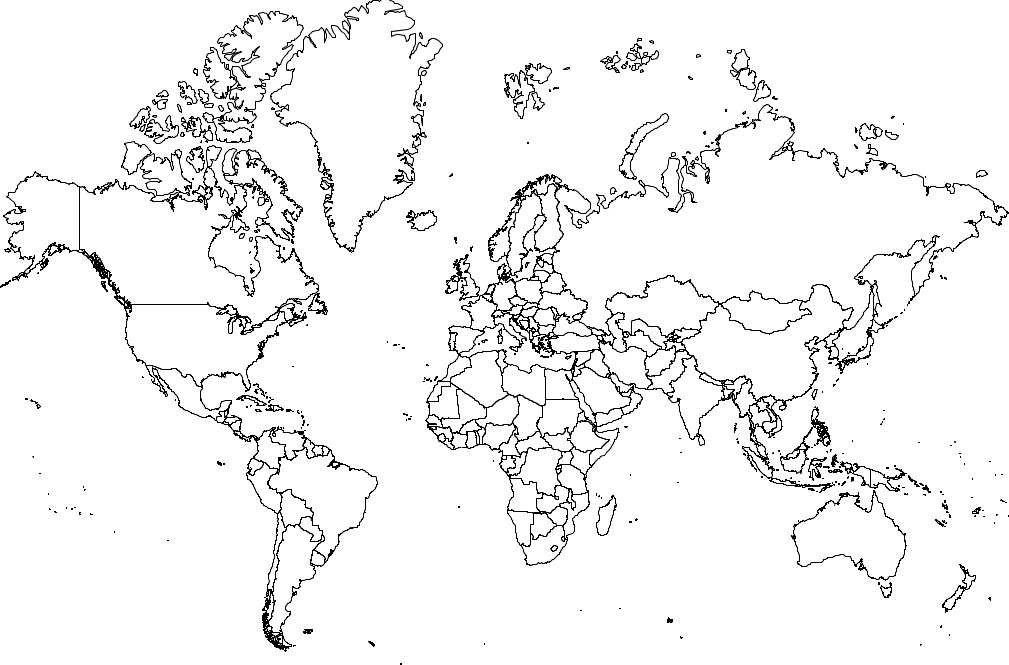
Here are some sample executions for the input files shapes.txt, usa.txt, iceland.txt, and world.txt. Additional input files are available for 100+ countries and all 50 U.S. states.
java-introcs WorldMap < shapes.txt
java-introcs WorldMap < usa.txt
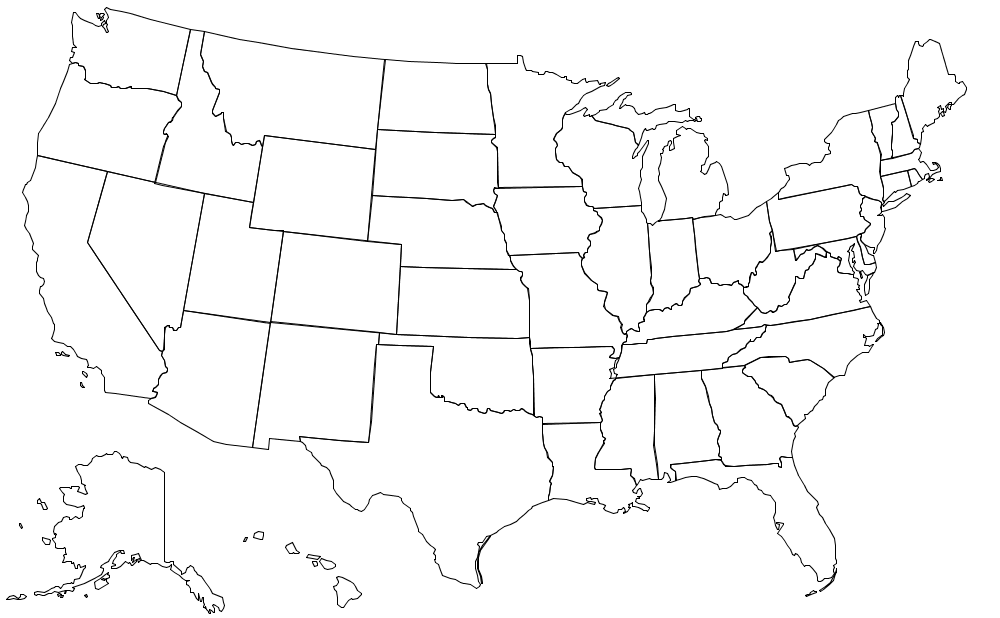
java-introcs WorldMap < iceland.txt
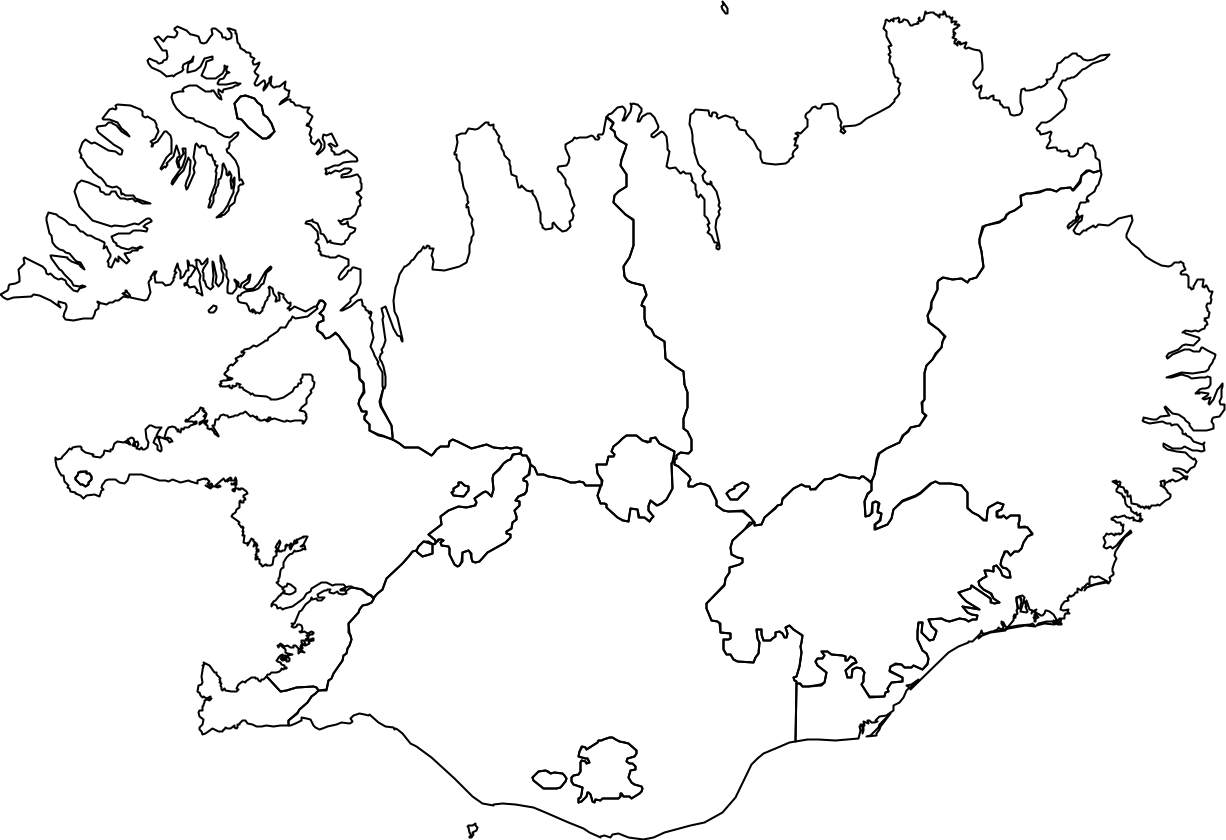
java-introcs WorldMap < world.txt
FAQs
Click on the ► icon to expand and the ▼ icon to hide each FAQ.
Can I draw the boundary of a region as a sequence of line segments instead of a polygon?
No. You must draw each polygon usingStdDraw.polygon(), as specified.
My program runs slowly for inputs with a large number of polygons. Any way to speed it up?
By default, as soon as you call a drawing method such as StdDraw.polygon(), the result appears on screen. However, updating the screen is a relatively expensive operation (in terms of CPU time). If there are thousands of geometric objects to draw, this can slow down your program considerably. To avoid this slowdown, use the double buffering feature of standard draw:
- Call
StdDraw.enableDoubleBuffering()once before any drawing code to enable double buffering. Now, all drawing will be done on an offscreen canvas. - Call the drawing commands such as
StdDraw.polygon(). Nothing will appear on screen at this time. - Call
StdDraw.show(). This will transfer the offscreen canvas to the onscreen canvas and you will see the drawing. You can think of double buffering as collecting all of the lines, points, shapes, and text that you tell it to draw, and then drawing them all simultaneously, upon request.
My favorite country is not supplied as one of the data files. Why not?
Sorry. A few of the source data files that we used had technical discrepancies, which made converting them into our format more challenging. If you wish to add a country, please send us an input file in the specified format.The displayed map distorts the areas of regions. How can I fix this?
Every map projection of a sphere on a plane result in some distortion. For example, with the Mercator projection, Greenland appears to be about the same size as Africa; in reality, the area of Africa is 14 times as large. The Gall–Peters projection avoids distorting areas; instead if distorts shapes.Submission
Submit DiceHistogram.java, EchoFilter.java, SoundWaveVisualizer.java, WorldMap.java, readme.txt and acknowledgments.txt files to TigerFile
.
Grading
| Files | Points |
|---|---|
| DiceHistogram.java | 9 |
| EchoFilter.java | 9 |
| SoundWaveVisualizer.java | 9 |
| WorldMap.java | 9 |
| readme.txt | 4 |
| Total | 40 |
This assignment was developed by Kevin Wayne. Copyright © 2022–2024.