
|
|
COS 323 - Computing for the Physical and Social Sciences |
Spring 2005 |
| Course home | Outline and lecture notes | Assignments |
Overview:
In this assignment, you will analyze the design of a truss bridge. The inputs will be the length and height of the bridge, the number of truss sections, and the amount of weight it needs to support. You will write a Matlab function that computes a matrix relating the net force on each joint to the tensile and compressive forces in the beams, and solve the resulting linear system to tell you how much tension or compression each beam undergoes. Finally, you will analyze how the optimal design depends on the number of sections and the height.
We will be working with a design called the Pratt truss, originally designed by Thomas and Caleb Pratt in 1844. Here is how it looks:
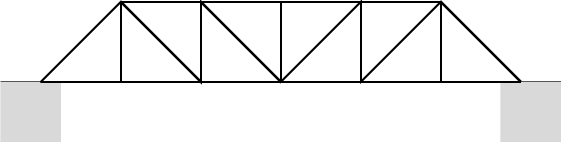
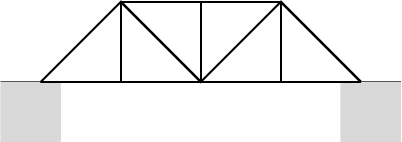
This particular (6-section) structure has 21 truss members and 12 joints. In general, we can extend the design to more or fewer sections (to keep things simple, let's only consider symmetric structures with an even number), and end up with 2n joints and 4n-3 members. Here are the designs for n = 4 and n = 2. The latter is called the King truss, and has been used since the middle ages.

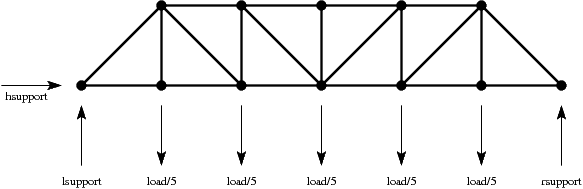
We are interested in computing the compression or tension on each beam, once forces are applied to the structure. To simplify things, we ignore the weight of the structure itself, and consider that the entire load is split evenly among the center sections while support forces are applied at the ends:
As a result of these applied forces, the truss members will have compressive and tensile forces applied to them. We adopt the convention that compression is positive and tension is negative, so a beam with a positive internal force will be pushing on the two joints it connects, while a member with negative force will be pulling. Now, we have the condition that the sum of forces at each joint must be zero. (Otherwise the joint would be accelerating - very much not what we want!) So, let's number the joints and members as follows
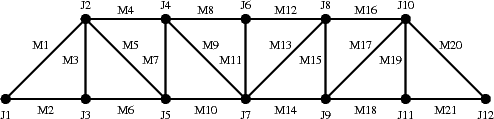
and consider the force diagram for J5:
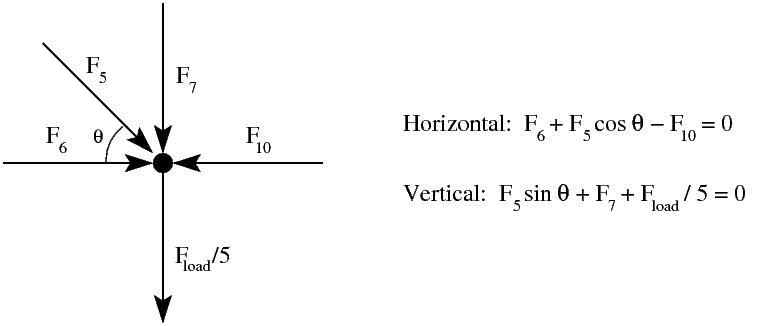
Therefore, we have two equations for each joint, one giving the horizontal balance of forces and one for vertical. The unknowns are the internal forces in each beam, plus the three support forces, giving us a total of 4n equations and 4n unknowns (the horizontal support will always be 0 in the case of a level structure, but we include it anyway to make the number of unknowns equal to the number of equations).
Write a Matlab function that takes as input:
A = zeros(4*n,4*n);then loop through the joints, filling in the appropriate nonzero entries.
Once you can create A and b, solving for x is as easy as
x = A\b;
Look at the pattern of compressive and tensile forces in the structure. Are the innermost diagonal members under compression or tension? Which beams have the greatest stresses for very tall bridges? For very short bridges?
Compute the maximum compressive or tensile force in any beam in the bridge (using the max and abs functions). Assuming all the beams are made with the same cross section, this will determine how thick the beams have to be. Since the capacity of a beam is proportional to its cross sectional area, and since the cost of the materials is proportional to length times area, the materials cost of the bridge is just proportional to
|max force| * (total length of beams)(ignoring things like safety margins, cost of the joints, resistance to wind forces, etc.) So, you can evaluate different designs for bridges that use different values for height and n (while holding total load and length constant):
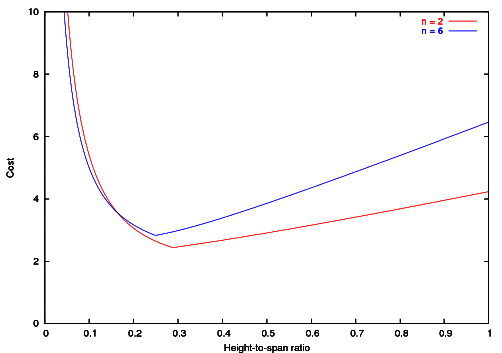
This graph shows the cost (y axis) for a given height-to-span ratio (x axis), for n = 2 (red) and n = 6 (blue). Try to produce graphs such as this for values of n from 2 to 10. Based on these, what can you say about when it's best to use different values of n? (e.g., for fairly low bridges, is it better to use more or fewer sections?) Can you generate a plot (using the Matlab plot command) showing the optimal height-to-width ratio as a function of n?
This assignment is due Thursday, March 10 at 11:59 PM. Please see the general notes on submitting your assignments, as well as the late policy and the collaboration policy.
Please submit:
Disclaimer: I am not a structural engineer. I don't even play
one on TV. Consult someone experienced before designing any real
bridges.