- Before we can run bochs, we must set up the configuration
file for bochs to use. This file, bochsrc should go
in the directory from where you will be running bochs. For simplicity, it may be useful to replace the default setting log: bochsout.txt with log: /dev/null so that we don't have to worry about filling up disk quotas on the lab machines with large transcripts of simulations.

- Let's start with the skeleton code for bootblock.s provided, but instead of jumping right in to the task at hand, we'll use the code to print a character to the screen (given on the Assembly Tips page) to explore the development workflow.
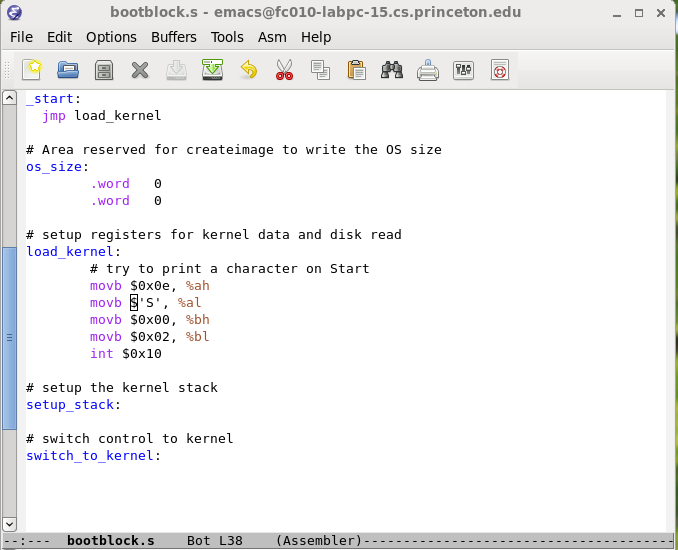
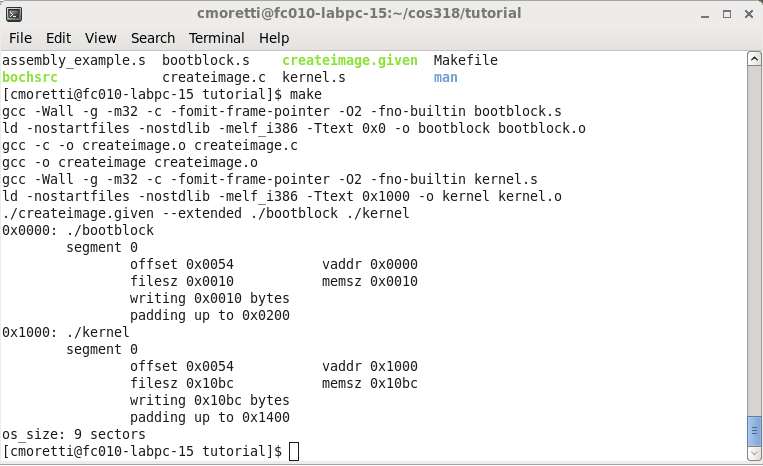
- Once we've edited bootblock.s, we will use the Makefile and the createimage.given binary provided to build the image file. (Note the extended information it prints about the ELF image, which is useful for debugging, and also will be required of the second half of this assignment.)
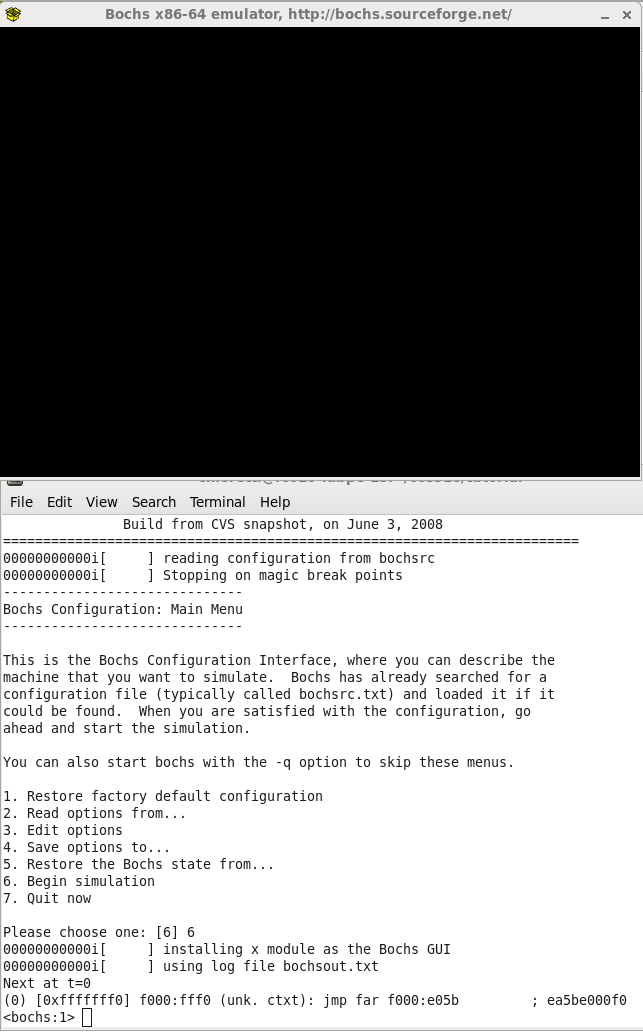
- We want to run bochs, which is an emulator, but it is most useful at this point to see the internals via a debugger. There is limited gdb support, discussed elsewhere, but for full functionality in this assignment the bochs internal debugger is the way to go. There is a pre-configured version available on the lab machines in /u/318/bin/bochsdbg.

- When bochsdbg starts we can choose option 6 to begin the simulation, and an emulator window will pop up, showing the current state of the machine (initially blank, as the machine has not booted). The terminal will enter a textual debugging interface similar to gdb.
- Initially we're interested in what happens beginning at the bootloader, so we want to set a breakpoint (the b command) at the memory address where the bootloader begins. Once that is done, we can examine a list of all breakpoints with the info break command.

- With the breakpoint set, we want to continue the simulation until we reach the breakpoint. As in gdb this can be done with the c command. Note that a lot of work is being done (from t=0 to t=~5million) in the BIOS to reach the bootloader. The debugger stops at the initial breakpoint, and again like in gdb we can step to the next instruction with the s command. (We need to step in order to reach our printing code, because the first instruction at the breakpoint is jmp load_kernel)

- The debugger prompt shows us the next instruction to be executed.
On the far right side of the instruction line, we can see the machine language code for the instruction (in this case: b (move immediate to register), 4 (8-bit register AH), 0e (immediate value $0x0e)).
Before the machine language code, we see a disassembly of it into assembly language. The instruction mov ah, 0x0e looks a lot like what our first instruction in the printing code was from step 2, much clearer than the machine code, but the syntax is a bit unfamiliar. We can switch between AT&T and Intel assembly syntax with the command disassemble switch-mode. Once we've done so, we can use the u command to display an instruction, in this case, repeating the previous prompt in a more familiar format. Multiple instructions can be displayed with the / modifier to the command.

- Since we're about to place a new value into register AH, now would be a good time to determine how to view the state of that register. This can be done with the r command. After stepping through the instruction, repeating the invocation will show us that the register was indeed changed from 0xaa to 0x0e.

- We can continue stepping through instructions to confirm that AL, BH, BL all assume the expected values from our simple movb instructions.

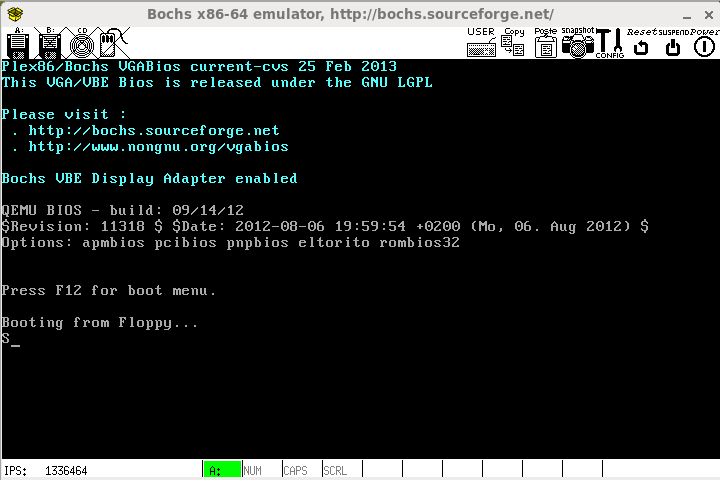
- At this point we can use the c command again to continue the simulation, which will execute the interrupt in the printing code (int $0x10), and in the emulation window we will see the character printed to the screen. (Warning: stepping into an interrupt will result in stepping through a very large number of instructions before the character prints.)
- Considering the warning above, we don't want to step into the interrupt, but we'd like to see the state of the simulation after returning from the interrupt. One possibility to to calculate the memory location and set a breakpoint as in step 6. But there is another type of breakpoint available in the bochs internal debugger. In step 1, notice that we enabled a setting called magic break. This is a special no-op instruction that is interpreted by the bochs internal debugger as a breakpoint with no action required by the user.

- After instering the magic breakpoint into the code, and rebuilding image with make, we can re-invoke bochsdbg to restart the simulation. Without using the b command to set a breakpoint, continue the simulation and the code will run - printing the debugging character to the screen - and the debugger will stop and prompt us after the magic breakpoint is hit.

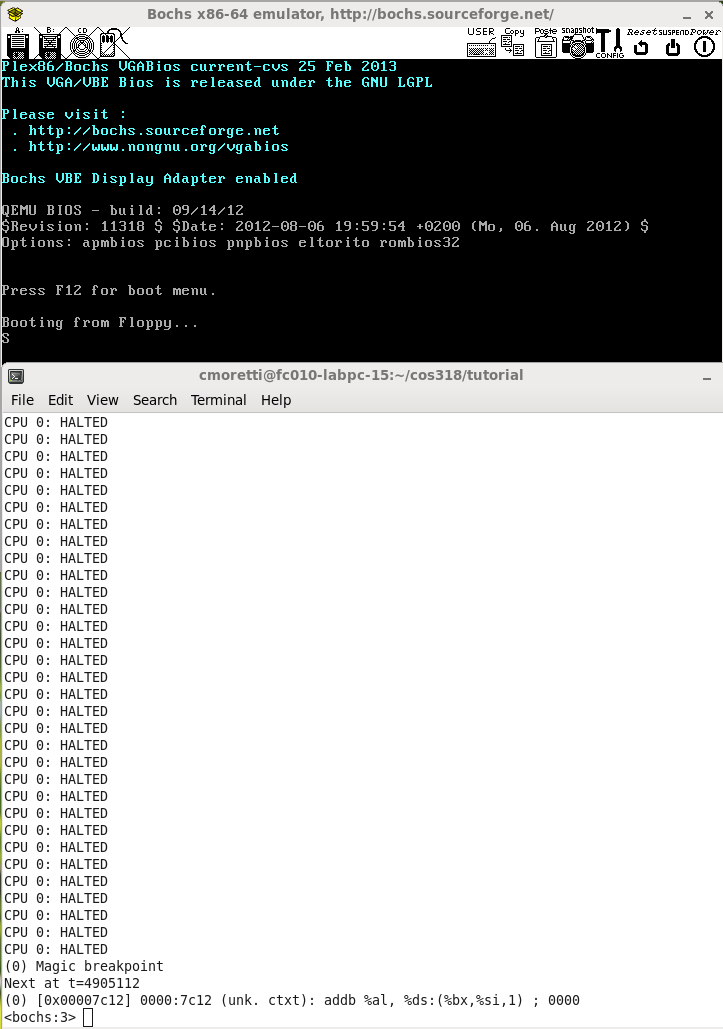
- Beyond the magic breakpoint, we might notice a cryptic assembly language instruction in the next prompt. Recall from step 8 that we can also use the actual machine language as a guide. In this case, the instruction is 0000, which indicates that we've reached the end of our code, because bochs automatically initializes all memory to zero. Thus, at this point we have completed the building blocks of the development workflow and are ready to move on to implementing the bootloader.