| 
|
Re-affirm the atomic nature of matter by tracking the motion of particles undergoing Brownian motion, fitting this data to Einstein's model, and estimating Avogadro's number.
Historical perspective. The atom played a central role in 20th century physics and chemistry, but prior to 1908 the reality of atoms and molecules was not universally accepted. In 1827, the botanist Robert Brown observed the random erratic motion of wildflower pollen grains immersed in water using a microscope. This motion would later become known as Brownian motion. Einstein hypothesized that this Brownian motion was the result of millions of tiny water molecules colliding with the larger pollen grain particles. In one of his "miraculous year" (1905) papers, Einstein formulated a quantitative theory of Brownian motion in an attempt to justify the "existence of atoms of definite finite size." His theory provided experimentalists with a method to count molecules with an ordinary microscope by observing their collective effect on a larger immersed particle. In 1908 Jean Baptiste Perrin used the recently invented ultramicroscope to experimentally validate Einstein's kinetic theory of Brownian motion, thereby providing the first direct evidence supporting the atomic nature of matter. His experiment also provided one of the earliest estimates of Avogadro's number. For this work, Perrin won the 1926 Nobel Prize in physics.
The problem. In this assignment, you will redo a version of Perrin's experiment. Your task is greatly simplified because with modern video and computer technology (in conjunction with your programming skills), it is possible to accurately measure and track the motion of an immersed particle undergoing Brownian motion. We supply video microscopy data of polystyrene spheres ("beads") suspended in water, undergoing Brownian motion. Your task is to write a program to analyze this data, determine how much each bead moves between observations, fit this data to Einstein's model, and estimate Avogadro's number.
The data. We provide several datasets, obtained by William Ryu using fluorescent imaging. Each run contains a sequence of two hundred 640-by-480 color JPEG images, frame00000.jpg through frame00199.jpg.
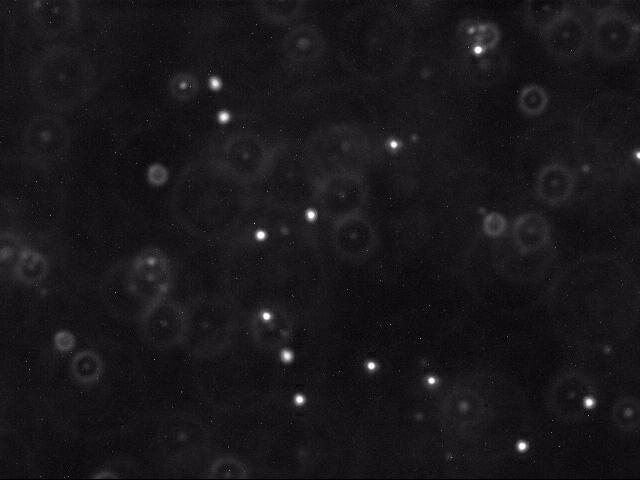
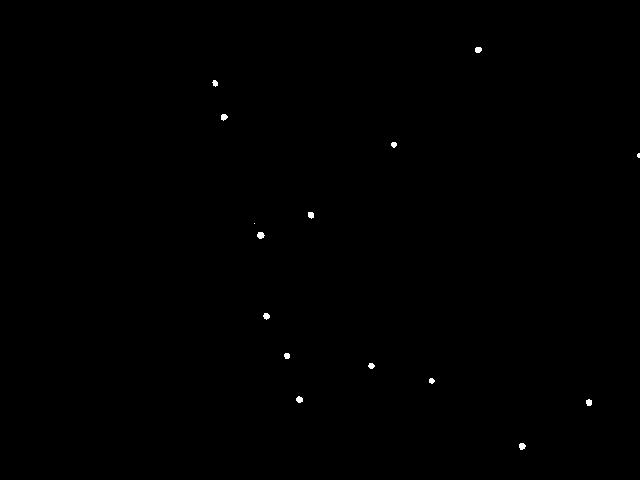
Here is a movie of several beads undergoing Brownian motion. Below is a typical raw image (left) and a cleaned up version (right) using thresholding as described below.
Each image shows a two-dimensional cross section of a microscope slide. The beads move in and out of the microscope's field of view (the x and y directions). Beads also move in the z-direction, so they can move in and out of the microscope's depth of focus; this results in halos, and it can also result in beads completely disappearing from the image.
Particle identification. The first challenge is to identify the beads amidst the noisy data. Each image is 640-by-480 pixels, and each pixel is represented by a Color object which needs to be converted to a luminance value ranging from 0 (black) to 255 (white). Whiter pixels correspond to beads (foreground) and blacker pixels to water (background). We break the problem into two independent pieces: (i) classifying the pixels as foreground or background, and (ii) finding the disc-shaped clumps of foreground pixels that constitute each bead.
public Blob()                    // construct an empty blob
public void add(int i, int j)    // add a pixel (i, j) to the blob
public int mass()                // return number of pixels added = its mass
public double distanceTo(Blob b) // return distance from the center of mass of this blob to b
public String toString()         // return string representation of this blob
For this part, write a data type BlobFinder that has the following API.
Include a main() method in BlobFinder.java that takes the name of a JPEG file as a command line argument, creates a BlobFinder object, print out all of the blobs (according to the definition above), and prints out all of the beads of size at least P. The values for P and threshold should be named constants in the main() method.// find all blobs in the given picture using the given luminance threshold public BlobFinder(Picture picture, double threshold) // return all beads: beads are blobs that are at least P pixels large public Blob[] getBeads(int P) // print out all blobs public void show()
The program identifies 15 blobs in the sample frame. It then recognizes 13 of them as beads. (It does not count as beads the blob abutting the right edge or the 1-pixel blob.) Our string representation of a blob specifies its mass (number of pixels) and its center of mass (in the 640-by-480 picture). By convention, pixels are measured from left-to-right, and from top-to-bottom (instead of bottom-to-top).% java BlobFinder run_1/frame00001.jpg Blobs: 29 (214.7241, 82.8276) 36 (223.6111, 116.6667) 1 (254.0000, 223.0000) 42 (260.2381, 234.8571) 35 (266.0286, 315.7143) 31 (286.5806, 355.4516) 37 (299.0541, 399.1351) 35 (310.5143, 214.6000) 31 (370.9355, 365.4194) 28 (393.5000, 144.2143) 27 (431.2593, 380.4074) 36 (477.8611, 49.3889) 38 (521.7105, 445.8421) 35 (588.5714, 402.1143) 13 (638.1538, 155.0000) Beads: 29 (214.7241, 82.8276) 36 (223.6111, 116.6667) 42 (260.2381, 234.8571) 35 (266.0286, 315.7143) 31 (286.5806, 355.4516) 37 (299.0541, 399.1351) 35 (310.5143, 214.6000) 31 (370.9355, 365.4194) 28 (393.5000, 144.2143) 27 (431.2593, 380.4074) 36 (477.8611, 49.3889) 38 (521.7105, 445.8421) 35 (588.5714, 402.1143)
Particle tracking. The next step is to determine how far a bead moved from one time step t to the next t + Δt. For our data, Δ t = 0.5 seconds per frame. We assume the data is such that each bead moves a relatively small amount, and that two beads do not collide. (However, we must account for the possibility that the bead disappears from the frame, either by departing the microscope's field of view in the x or y direction, or moving out of the microscope's depth of focus in the z direction.) Thus, for each bead at time t + Δt, we calculate the closest bead at time t (in Euclidean distance) and identify these two as the same beads. However, if the distance is too large (greater than 25.0 pixels) we assume that one of the beads has either just begun or ended its journey. We record the displacement that each bead travels in the Δt units of time.
Write a main() method in BeadTracker.java that takes a sequence of JPEG filenames as command line inputs, identifies the beads in each JPEG image (using BlobFinder), and prints out (one per line) the radial displacement that each bead moves from one frame to the next. Note that it is not necessary to explicitly track a bead through a sequence of frames - you only need to worry about identifying the same bead two consecutive frames at a time.
% java BeadTracker run_1/*.jpg
 7.183
 4.793
 2.169
 5.529
 5.429
 4.396
...
Data analysis. Einstein's theory of Brownian motion connects macroscopic properties (e.g., radius, diffusivity) of the beads to microscopic properties (e.g., temperature, viscosity) of the fluid in which the beads are immersed. This amazing theory enables us to estimate Avogadro's number with an ordinary microscope by observing the collective effect of millions of water molecules on the beads.
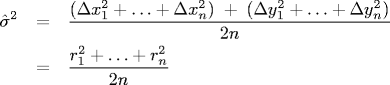
For our data, Δt = 0.5 so this is an estimate for D as well. The radial displacements ri are measured in pixels: to convert to meters, multiply by 0.175 * 10-6 (meters per pixel).

and k is the Boltzmann constant. All parameters are given in SI units. The Boltzmann constant is a fundamental physical constant that relates the average kinetic energy of a molecule to its temperature. We estimate k by measuring all of the parameters in the Stokes-Einstein equation, and solving for k.
For the final part, write a main() method in Avogadro.java that reads in the displacements (from standard input or piped directly from the output of BeadTracker as in the example below) and computes an estimate of Boltzmann's constant and Avogadro's number using the formula described above.
% java BeadTracker run_1/*.jpg | java Avogadro
Boltzmann =   1.254e-23
Avogadro  =   6.633e+23
Run-time analysis. Your BeadTracker program is the one that takes the longest amount of time to run. If we think of N as the total number of pixels across all frames being processed, then what is the average case running time of your BeadTracker program? How will you measure this? You can either use a stop watch or use the -Xprof feature of java. Either way, make sure you redirect the output to a file so you don't have the time to write to the screen slowing your output and overshadowing the processing time. Notice how we use the wildcard capability of the command-line to process all 200 frames in the sample run above. How could you easily alter that to run 100 frames? 10 frames? Analyze the timing data and include it in your readme.txt.
Getting started. The directory atomic from the COS126 ftp site contains files you will find useful to use like Picture.java, StdIn.java and StdOut.java. You also might want to use or look at Luminance.java when you compute the threshold value of a particular pixel. The file beads-run_1.txt lists the beads found in each frame of run_1 using tau = 180.0 and P = 25. The files displacements-run_1.txt and displacements-run_2.txt are the output of BeadTracker for those runs. You can use these files as input to test your Avogadro program even before you finish BeadTracker. The subdirectories run_1 through run_10 each contain 200 picture frames for you to use as input. The directory also contains this assignment's readme.txt file.
Submission. Submit Blob.java, BlobFinder.java, BeadTracker.java and Avogadro.java. Finally, submit a readme.txt file and answer the questions. If your program has any dependencies other than StdIn.java, StdOut.java, Luminance.java and Picture.java submit that as well.